. 2013 Feb 15;515(1):128-39.
doi: 10.1016/j.gene.2012.11.010. Epub 2012 Dec 6.

A recombinase paralog from the hyperthermophilic crenarchaeon Sulfolobus solfataricus enhances SsoRadA ssDNA binding and strand displacement

Affiliations

A recombinase paralog from the hyperthermophilic crenarchaeon Sulfolobus solfataricus enhances SsoRadA ssDNA binding and strand displacement

William J Graham 5th et al. Gene. .

Abstract

Homologous recombination (HR) is a major pathway for the repair of double-strand DNA breaks, a highly deleterious form of DNA damage. The main catalytic protein in HR is the essential RecA-family recombinase, which is conserved across all three domains of life. Eukaryotes and archaea encode varying numbers of proteins paralogous to their main recombinase. Although there is increasing evidence for the functions of some of these paralog proteins, overall their mechanism of action remains largely unclear. Here we present the first biochemical characterization of one of the paralog proteins, SsoRal3, from the crenarchaeaon Sulfolobus solfataricus. The SsoRal3 protein is a ssDNA-dependent ATPase that can catalyze strand invasion at both saturating and subsaturating concentrations. It can bind both ssDNA and dsDNA, but its binding preference is altered by the presence or absence of ATP. Addition of SsoRal3 to SsoRadA nucleoprotein filaments reduces total ATPase activity. Subsaturating concentrations of SsoRal3 increase the ssDNA binding activity of SsoRadA approximately 9-fold and also increase the persistence of SsoRadA catalyzed strand invasion products. Overall, these results suggest that SsoRal3 functions to stabilize the SsoRadA presynaptic filament.


Figures

Fig. 1
Fig. 1
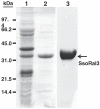
SDS-PAGE of SsoRal3 purification. Samples from major steps during purification were subjected to SDS-PAGE using a 10% acrylamide tricine gel and stained with Coomassie brilliant blue R250. Lane 1: clarified, heat treated crude sonicate; lane 2: pooled fractions after Blue-Sepharose; lane 3: final purified, concentrated SsoRal3 (5 μg). The position of the SsoRal3 protein is indicated by the arrow.
Fig. 2
Fig. 2
SsoRal3 is a ssDNA dependent ATPase with a DNA binding site-size of approximately four nucleotides. All data were obtained using the coupled ATPase assay as described (Rolfsmeier and Haseltine, 2010; Seybert et al., 2002). Assays in (a) and (c) were performed at 70 °C. (a) All reactions contained 0.6 μM DNA and were initiated with 0.2 μM SsoRal3. DNA used was circular φX174 ssDNA (green squares), poly(dT) (purple triangles), and pBR322 dsDNA (red diamonds). Black inverted triangles indicate assays that contained no DNA. (b) Points represent percent activity of SsoRal3 at various temperatures. The activity at 70 °C was defined as 100%, and all other points are portions thereof. (c) The φX174 ssDNA concentration was held constant at 0.6 μM and reactions were initiated with varying concentrations of SsoRal3. Points represent the velocity obtained from the slope of the linear portion of a curve generated from each experiment. Error bars in all panels represent standard deviation of a minimum of at least three separate experiments.
Fig. 3
Fig. 3
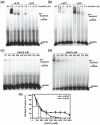
ATP alters SsoRal3 DNA binding preference. The top two panels are representative EMSA autoradiographs of SsoRal3-ssDNA binding (a) and SsoRal3-dsDNA binding (b) in the presence or absence of ATP with 50 mM NaCl. Panels (c) and (d) are representative autoradiographs of NaCl titrations of SsoRal3 bound to ssDNA or dsDNA respectively. Reactions with ssDNA included ATP, while ATP was omitted for those with dsDNA. NP indicates no protein control reactions. (e) Quantitation of binding affinity through salt midpoint titration, where the mobility shift apparent at 50 mM NaCl was designated as 100%. Squares represent ssDNA shifts while triangles represent dsDNA shifts. The dashed lines indicate 50% binding. Error bars represent standard deviation from a minimum of three separate experiments.
Fig. 4
Fig. 4
SsoRal3 enhances SsoRadA binding to ssDNA in the presence of ATP. Representative EMSA autoradiograph showing shifts produced with varying concentrations of SsoRal3 and SsoRadA proteins either together (lanes 5, 6, 11, 12) or separately (lanes 1–4, 7–10). Lanes 1-6 represent reactions that included 3 mM ATP, while lanes 7–12 were reactions where ATP was omitted. All reactions contained 5 μM ssDNA. Shifted products and ssDNA are indicated by arrows.
Fig. 5
Fig. 5
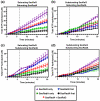
Order of addition experiments suggest SsoRal3 alters the ATPase activity of SsoRadA. (a-d) Effects of SsoRal3 on SsoRadA activity was determined using the coupled ATPase assay at 70 °C (Rolfsmeier and Haseltine, 2010; Seybert et al., 2002). In all panels, DNA was ssφX174. Symbols represent: SsoRal3 alone (purple triangles), SsoRadA alone (green squares), SsoRal3 added first (blue inverted triangles), SsoRadA added first (black circles), and SsoRal3 and SsoRadA added together (red diamonds). The vertical dashed line indicates the time at which the second protein was added, as applicable. (a) SsoRal3 and SsoRadA were saturating (0.2 μM). (b) SsoRadA was saturating (0.2 μM) and SsoRal3 was subsaturating (0.08 μM). (c) SsoRadA was subsaturating (0.08 μM) and SsoRal3 was saturating (0.2 μM). (d) Both SsoRadA and SsoRal3 were subsaturating (0.08 μM). Error bars represent standard deviation of a minimum of three separate experiments. The y-axes for panels (b)–(d) have been adjusted to a smaller maximum than that for panel (a) in order to better show the data.
Fig. 6
Fig. 6
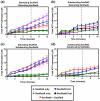
Order of addition experiments including the single-strand DNA binding protein SsoSSB. (a–d) Effects of SsoRal3 on SsoRadA activity in the presence of ssDNA substrate pre-bound with SsoSSB as determined using the coupled ATPase assay at 70 °C (Rolfsmeier and Haseltine, 2010; Seybert et al., 2002). In all panels, DNA was ssφX174 and SsoSSB was used at a concentration of 0.04 μM. The symbols are: SsoRal3 alone (purple triangles), SsoRadA alone (green squares), SsoRal3 added first (blue inverted triangles), SsoRadA added first (black circles), and SsoRal3 and SsoRadA added together (red diamonds). The vertical dashed line indicates the time at which the second protein was added, as applicable. (a) SsoRal3 and SsoRadA were saturating (0.2 μM). (b) SsoRadA was saturating (0.2 μM) and SsoRal3 was subsaturating (0.08 μM). (c) SsoRadA was subsaturating (0.08 μM) and SsoRal3 was saturating (0.2 μM). (d) Both SsoRadA and SsoRal3 were subsaturating (0.08 μM). Error bars represent standard deviation of a minimum of three separate experiments.
Fig. 7
Fig. 7
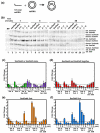
SsoRal3 increases the persistence of SsoRadA catalyzed D-loops. (a) Schematic of the D-loop reaction. (b) Representative autoradiographs of D-loop time courses. Saturating (0.6 μM) and subsaturating (0.12 μM) concentrations of SsoRadA and SsoRal3 are indicated to the right of the panel. Where indicated, 0.09 μM SsoSSB was pre-incubated with the oligonucleotide prior to addition of SsoRal3 and/or SsoRadA. Lane 1 represents reactions that did not contain protein and were incubated for 30 min, serving as a control. (c–f) Quantitation of D-loop formation. All conditions are shown relative to the invasion product generated after 1 min by saturating SsoRadA, which was arbitrarily set at 1. Error bars represent the standard deviation of a minimum of 3 separate experiments. The concentration of protein in each time course is indicated below the corresponding group of bars. (c) SsoRadA or SsoRal3 alone or with SsoSSB at various concentrations; (d) SsoRadA and SsoRal3 were added to the reaction simultaneously; (e) SsoRadA was added to the reaction prior to addition of SsoRal3; (f) SsoRal3 was added to the reaction prior to addition of SsoRadA.
Fig. 8
Fig. 8
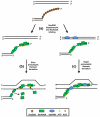
Model for the involvement of SsoRal3 in stabilization of the SsoRadA presynaptic filament during strand invasion. (a) Teterameric SsoSSB displacement is necessary to allow SsoRadA binding (b) SsoRadA presynaptic filament formation and strand invasion in the absence of SsoRal3. The dynamic character of the presynaptic filament results in slow formation of an active presynaptic filament, delaying strand invasion. (c) SsoRadA presynaptic filament formation and strand invasion in the presence of SsoRal3. SsoRal3 is stored in an inactive state on dsDNA in the absence of ATP. ATP addition permits SsoRal3 binding to ssDNA, stabilizing the presynaptic filament and enhancing strand invasion.

Similar articles

Cited by

References

    1. Arenson TA, Tsodikov OV, Cox MM. Quantitative analysis of the kinetics of end-dependent disassembly of RecA filaments from ssDNA. J. Mol. Biol. 1999;288:391–401. - PubMed
    1. Braybrooke JP, Spink KG, Thacker J, Hickson ID. The RAD51 family member, RAD51L3, is a DNA-stimulated ATPase that forms a complex with XRCC2. J. Biol. Chem. 2000;275:29100–29106. - PubMed
    1. Bugreev DV, Mazin AV. Ca2+ activates human homologous recombination protein Rad51 by modulating its ATPase activity. Proc. Natl. Acad. Sci. U. S. A. 2004;101:9988–9993. - PMC - PubMed
    1. Carreira A, Kowalczykowski SC. Two classes of BRC repeats in BRCA2 promote RAD51 nucleoprotein filament function by distinct mechanisms. Proc. Natl. Acad. Sci. U. S. A. 2011;108:10448–10453. - PMC - PubMed
    1. Forget AL, Kowalczykowski SC. Single-molecule imaging brings Rad51 nucleoprotein filaments into focus. Trends Cell Biol. 2010;20:269–276. - PMC - PubMed

Publication types

MeSH terms

LinkOut - more resources