. 2013 Mar;27(2):721-30.
doi: 10.1016/j.tiv.2012.11.017. Epub 2012 Dec 7.

Toxicological analysis of limonene reaction products using an in vitro exposure system

Affiliations

Toxicological analysis of limonene reaction products using an in vitro exposure system

Stacey E Anderson et al. Toxicol In Vitro. 2013 Mar.

Abstract

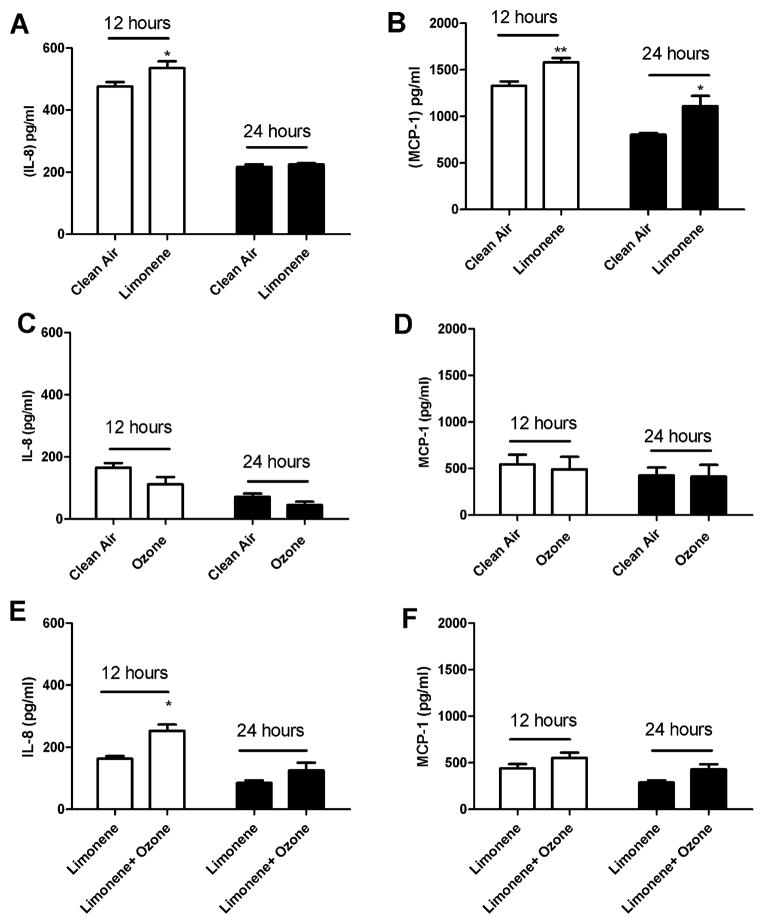
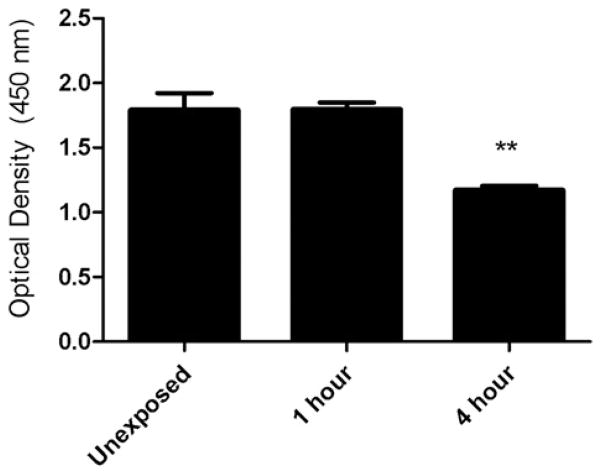
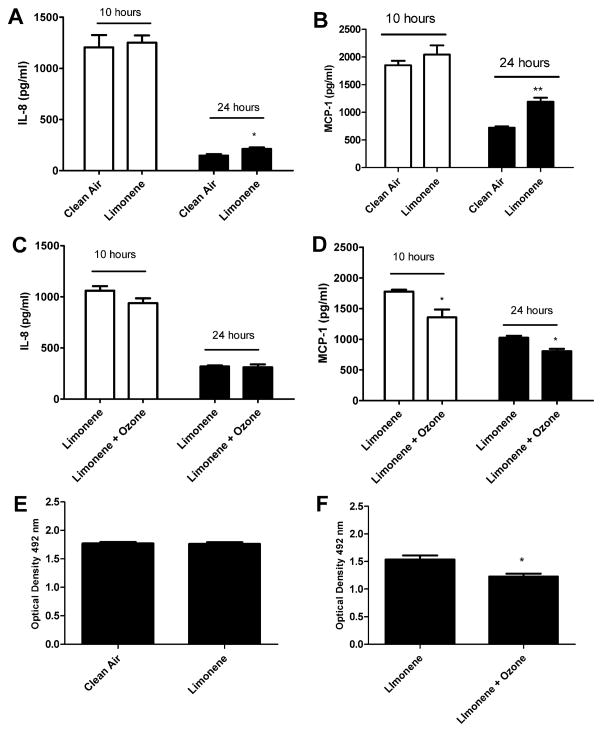
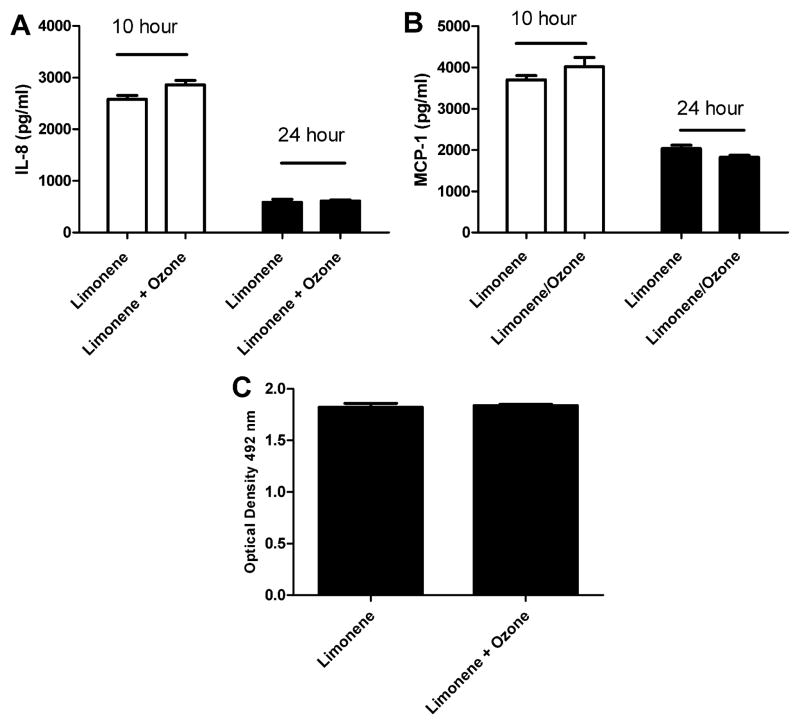
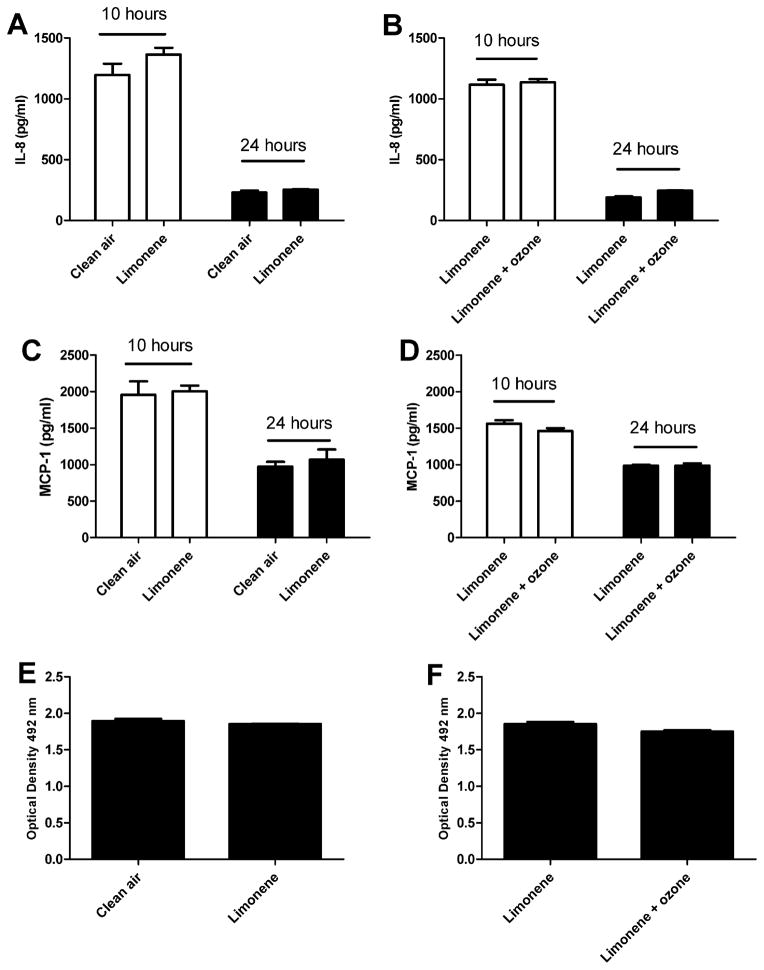
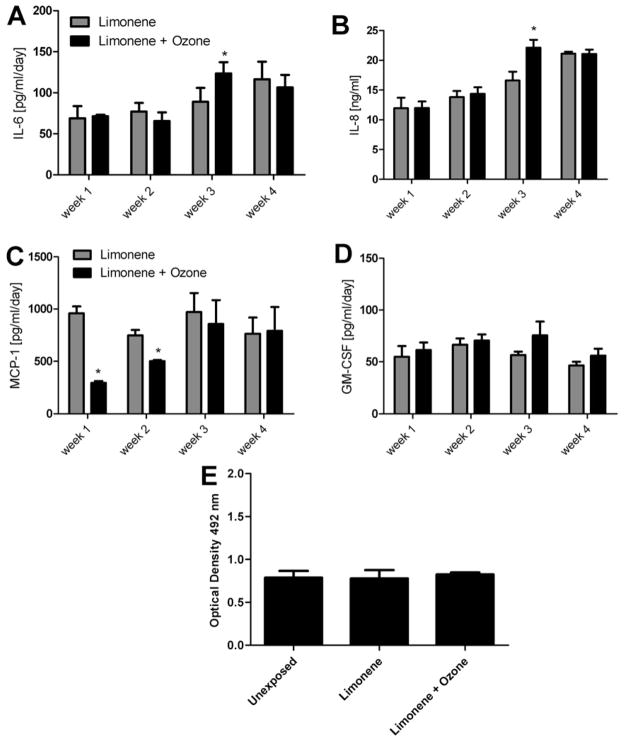
Epidemiological investigations suggest a link between exposure to indoor air chemicals and adverse health effects. Consumer products contain reactive chemicals which can form secondary pollutants which may contribute to these effects. The reaction of limonene and ozone is a well characterized example of this type of indoor air chemistry. The studies described here characterize an in vitro model using an epithelial cell line (A549) or differentiated epithelial tissue (MucilAir™). The model is used to investigate adverse effects following exposure to combinations of limonene and ozone. In A549 cells, exposure to both the parent compounds and reaction products resulted in alterations in inflammatory cytokine production. A one hour exposure to limonene+ozone resulted in decreased proliferation when compared to cells exposed to limonene alone. Repeated dose exposures of limonene or limonene+ozone were conducted on MucilAir™ tissue. No change in proliferation was observed but increases in cytokine production were observed for both the parent compounds and reaction products. Factors such as exposure duration, chemical concentration, and sampling time point were identified to influence result outcome. These findings suggest that exposure to reaction products may produce more severe effects compared to the parent compound.


Figures

Fig. 1
Fig. 1
GC/MS chromatogram of SPME sampled limonene and limonene/ozone chambers. Peak areas are proportional to concentration and all peaks are on the same y-axis scale. Solid line is the chromatographic peak of limonene only (20 ppm) chamber (shifted by +0.05 min for clarity). Gray dashed line is the chromatographic peak of limonene (20 ppm) in limonene/ozone chamber prior to addition of ozone while black dashed line is limonene peak in limonene/ozone chamber after ozone (4 ppm) addition.
Fig. 2
Fig. 2
The effect of limonene and limonene + ozone reaction products on A549 cells following a 4 h exposure. A549 cells (250,000) were incubated for 24 h on transwell inserts prior to exposure. Following exposure, cells were evaluated for IL-8 and MCP-1 protein production at 12 and 24 h post-exposure. Comparisons were made for (A and B) clean air vs. limonene (20 ppm), (C and D) clean air vs. ozone (4 ppm) and (E and F) limonene (20 ppm) vs. limonene (20 ppm)/ozone (4 ppm). Bars represent the mean ± SE from three independent biological replicates per exposure group. Significant differences are designated with *p < 0.05.
Fig. 3
Fig. 3
The effect of exposure duration on proliferation of A549 cells. A549 cells (250,000) were incubated for 48 h on transwell insert prior to exposure. Unexposed cells remained in incubator (37 °C, 5% CO2) while clean air was delivered to exposed cells for 1 or 4 h. Cell proliferation was evaluation 24 h post exposure. Bars represent the mean ± SE from three independent biological replicates per exposure group. Significant differences are designated with **p < 0.01.
Fig. 4
Fig. 4
The effect of limonene and limonene + ozone reaction products on A549 cells following a 1 h exposure. A549 cells (250,000) were incubated for 48 h on transwell insert prior to exposure. Following exposure, cells were evaluated for IL-8 (A and B) and MCP-1 (C and D) protein production at 10 and 24 h post-exposure and cell proliferation (E and F) at 24 h post exposure. Comparisons were made for clean air vs. limonene (20 ppm) and limonene (20 ppm) vs. limonene (20 ppm)/ozone (4 ppm). Bars represent the mean ± SE from 3 independent biological replicates per exposure group. Significant differences are designated with **p < 0.01 or *p < 0.05.
Fig. 5
Fig. 5
The effect of limonene and limonene + ozone reaction products on stimulated A549 cells following a 1 h exposure. A549 cells (250,000) were incubated for 48 h on transwell insert prior to exposure. Following exposure, TNF-α stimulated cells (2 ng/ml) were evaluated for IL-8 (A) and MCP-1 (B) protein production at 10 and 24 h postexposure and cell proliferation (C) at 24 h post exposure. Comparisons were made between limonene (20 ppm) vs. limonene (20 ppm)/ozone (4 ppm). Bars represent the mean ± SE from three independent biological replicates per exposure group.
Fig. 6
Fig. 6
The effect of exposure concentration on A549 cells following a 1 h exposure. A549 cells (250,000) were incubated for 48 h on transwell insert prior to exposure. Following exposure, cells were evaluated for IL-8 (A and B) and MCP-1 (C and D) protein production at 10 and 24 h post-exposure and cell proliferation (E and F) at 24 h post exposure. Comparisons were made for clean air vs. limonene (500 ppb) and limonene (500 ppb) vs. limonene (500 ppb)/ozone (100 ppb). Bars represent the mean ± SE from three independent biological replicates per exposure group. Significant differences are designated with **p < 0.01 or *p < 0.05.
Fig. 7
Fig. 7
The effect of limonene and limonene + ozone reaction products on MucilAir tissue following a repeated dose exposure. MucilAir tissue was exposed to limonene (500 ppb) vs. limonene (500 ppb)/ozone (100 ppb) for 1 h per day/5 days per week/4 weeks. 72 h following the final weekly exposure, supernatant was evaluated for IL-8 (A), IL-6 (B), MCP-1 (C), and GM-CSF (D) protein production. Cell proliferation was evaluated 72 h following the final experimental exposure (E). Comparisons were made for unexposed vs. limonene (500 ppb) and limonene (500 ppb) vs. limonene (500 ppb)/ozone (100 ppb). Basal cytokine levels for unexposed tissues are as follows: IL-6 (70 ± 8 pg/ml), IL-8 (15 ± 1 pg/ml), MCP-1 (837 ± 263 pg/ml), and GM-CSF (59 ± 9 pg/ml). Bars represent the mean ± SE from three independent biological replicates per exposure group. Significant differences are designated with *(p < 0.05).

References

    1. Anderson SE, Jackson LG, Franko J, Wells JR. Evaluation of dicarbonyls generated in a simulated indoor air environment using an in vitro exposure system. Toxicol Sci. 2010;115:453–461. - PMC - PubMed
    1. Arif AA, Shah SM. Association between personal exposure to volatile organic compounds and asthma among US adult population. Int Arch Occup Environ Health. 2007;80:711–719. - PubMed
    1. Bafadhel M, McCormick M, Saha S, McKenna S, Shelley M, Hargadon B, Mistry V, Reid C, Parker D, Dodson P, et al. Profiling of sputum inflammatory mediators in asthma and chronic obstructive pulmonary disease. Respiration. 2012;83:36–44. - PMC - PubMed
    1. Bakand S, Winder C, Khalil C, Hayes A. Toxicity assessment of industrial chemicals and airborne contaminants: transition from in vivo to in vitro test methods: a review. Inhalation Toxicol. 2005;17:775–787. - PubMed
    1. Bonisch U, Bohme A, Kohajda T, Mogel I, Schutze N, von Bergen M, Simon JC, Lehmann I, Polte T. Volatile organic compounds enhance allergic airway inflammation in an experimental mouse model. PLoS ONE. 2012;7:e39817. - PMC - PubMed

Publication types