

Regional vulnerability in Huntington's disease: fMRI-guided molecular analysis in patients and a mouse model of disease
- PMID: 23220414
- PMCID: PMC4435974
- DOI: 10.1016/j.nbd.2012.11.014
Regional vulnerability in Huntington's disease: fMRI-guided molecular analysis in patients and a mouse model of disease
Erratum in
- Neurobiol Dis. 2013 Jun;54:115
Abstract
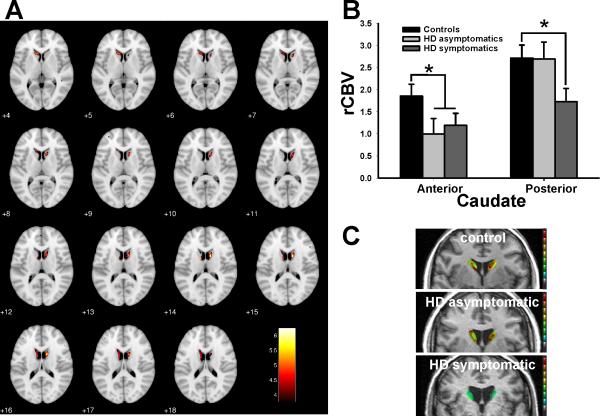
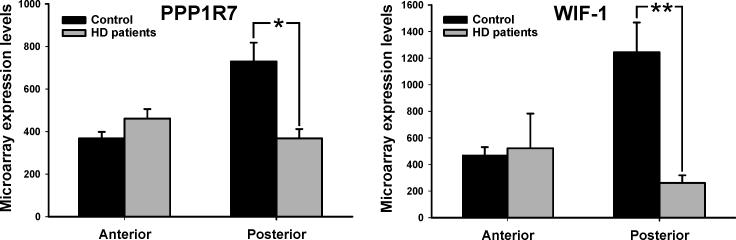
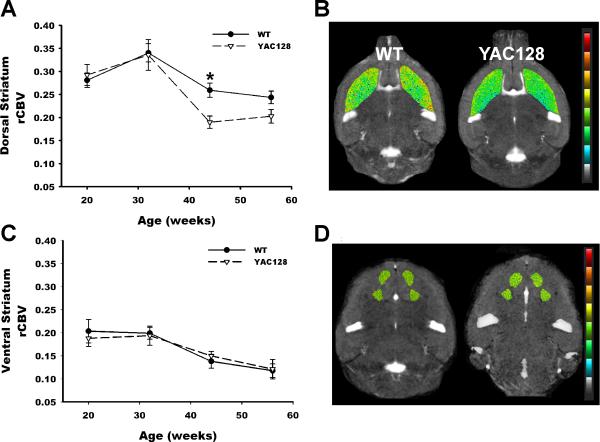
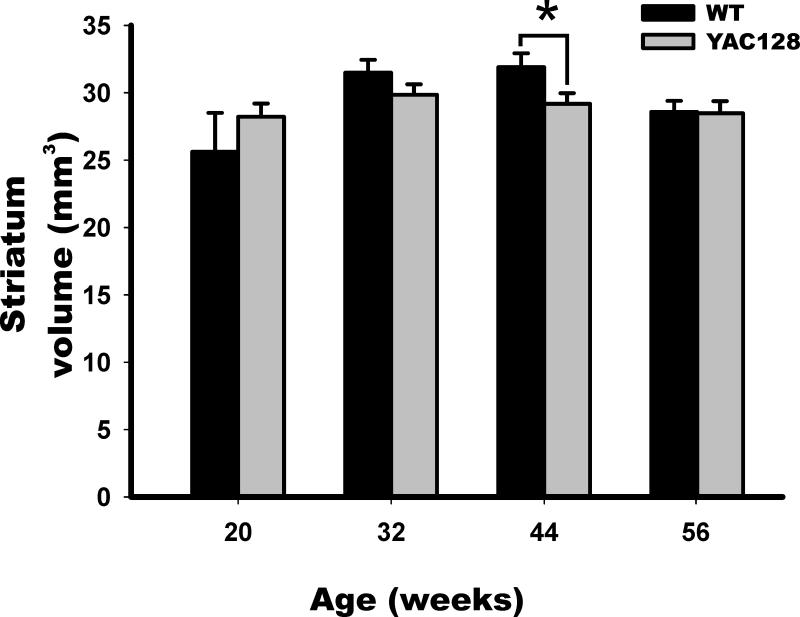
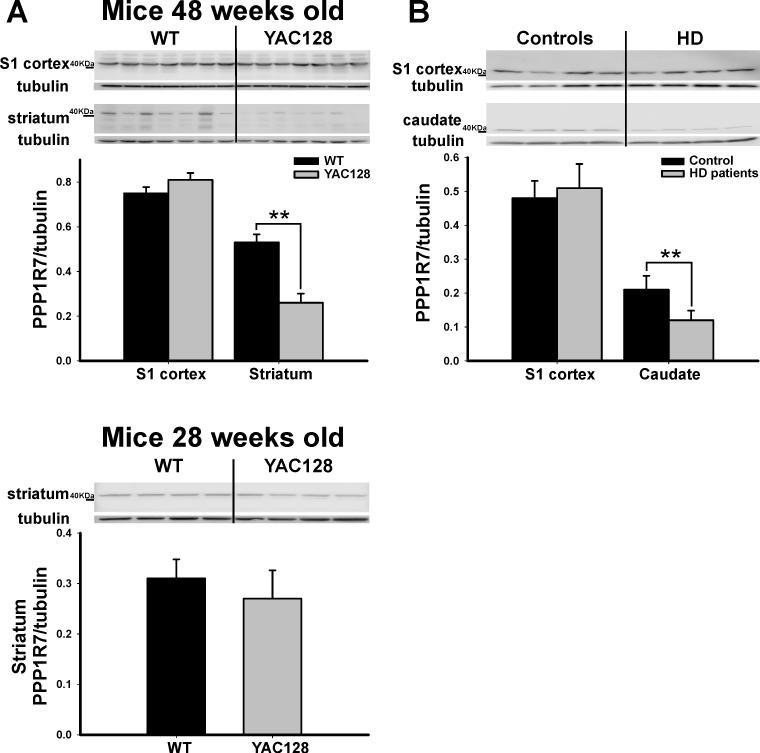
Although the huntingtin gene is expressed in brain throughout life, phenotypically Huntington's disease (HD) begins only in midlife and affects specific brain regions. Here, to investigate regional vulnerability in the disease, we used functional magnetic resonance imaging (fMRI) to translationally link studies in patients with a mouse model of disease. Using fMRI, we mapped cerebral blood volume (CBV) in three groups: HD patients, symptom-free carriers of the huntingtin genetic mutation, and age-matched controls. In contrast to a region in the anterior caudate, in which dysfunction was linked to genotype independent of phenotype, a region in the posterior body of the caudate was differentially associated with disease phenotype. Guided by these observations, we harvested regions from the anterior and posterior body of the caudate in postmortem control and HD human brain tissue. Gene-expression profiling identified two molecules whose expression levels were most strongly correlated with regional vulnerability - protein phosphatase 1 regulatory subunit 7 (PPP1R7) and Wnt inhibitory factor-1 (WIF-1). To verify and potentially extend these findings, we turned to the YAC128 (C57BL/6J) HD transgenic mice. By fMRI we longitudinally mapped CBV in transgenic and wildtype (WT) mice, and over time, abnormally low fMRI signal emerged selectively in the dorsal striatum. A relatively unaffected brain region, primary somatosensory cortex (S1), was used as a control. Both dorsal striatum and S1 were harvested from transgenic and WT mice and molecular analysis confirmed that PPP1R7 deficiency was strongly correlated with the phenotype. Together, converging findings in human HD patients and this HD mouse model suggest a functional pattern of caudate vulnerability and that variation in expression levels of herein identified molecules correlate with this pattern of vulnerability.
Copyright © 2012 Elsevier Inc. All rights reserved.
Figures
References
-
- Ashburner J, Friston KJ. Voxel-based morphometry--the methods. Neuroimage. 2000;11:805–21. - PubMed
-
- Bayram-Weston Z, et al. Light and electron microscopic characterization of the evolution of cellular pathology in YAC128 Huntington's disease transgenic mice. Brain Res Bull. 2012;88:137–47. - PubMed
-
- Belliveau JW, et al. Functional mapping of the human visual cortex by magnetic resonance imaging. Science. 1991;254:716–9. - PubMed
-
- Brooks S, et al. Longitudinal analysis of the behavioural phenotype in YAC128 (C57BL/6J) Huntington's disease transgenic mice. Brain Res Bull. 2010 - PubMed
Publication types
MeSH terms
Substances
Associated data
- Actions
Grants and funding
LinkOut - more resources
Full Text Sources
Other Literature Sources
Medical
Molecular Biology Databases
Miscellaneous
