. 2013 Mar;21(3):450-61.
doi: 10.1016/j.joca.2012.11.016. Epub 2012 Dec 5.

Direct assessment of articular cartilage and underlying subchondral bone reveals a progressive gene expression change in human osteoarthritic knees

Affiliations

Direct assessment of articular cartilage and underlying subchondral bone reveals a progressive gene expression change in human osteoarthritic knees

C-H Chou et al. Osteoarthritis Cartilage. 2013 Mar.

Abstract

Objective: To evaluate the interaction of articular cartilage (AC) and subchondral bone (SB) through analysis of osteoarthritis (OA)-related genes of site-matched tissue.

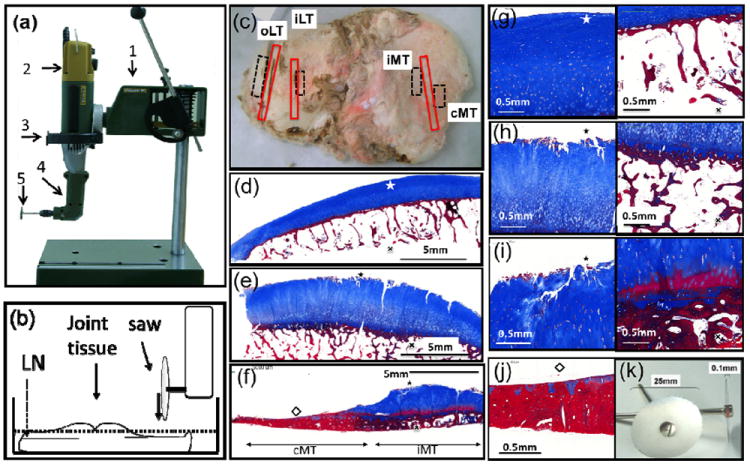
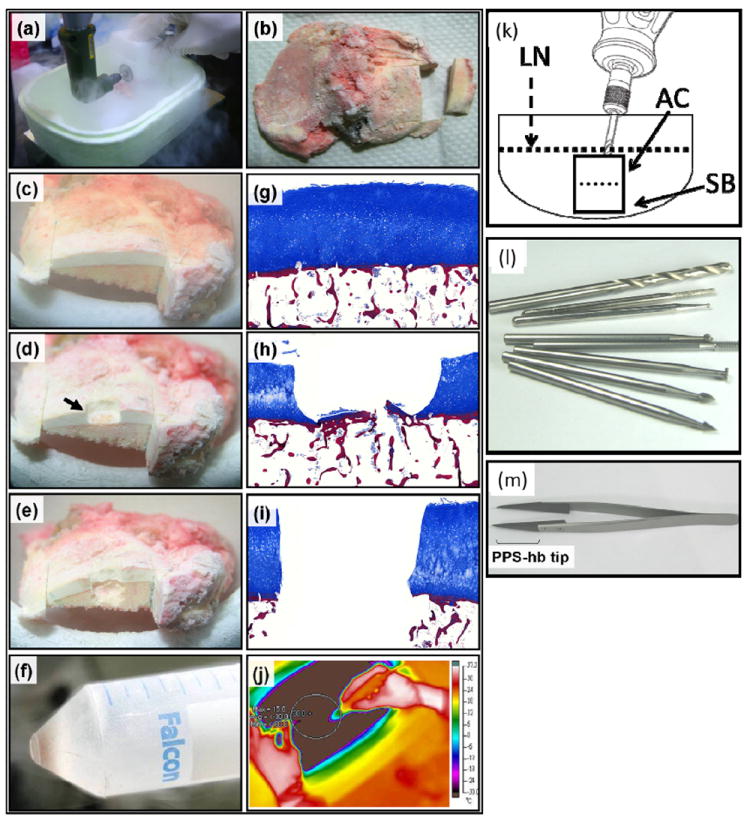
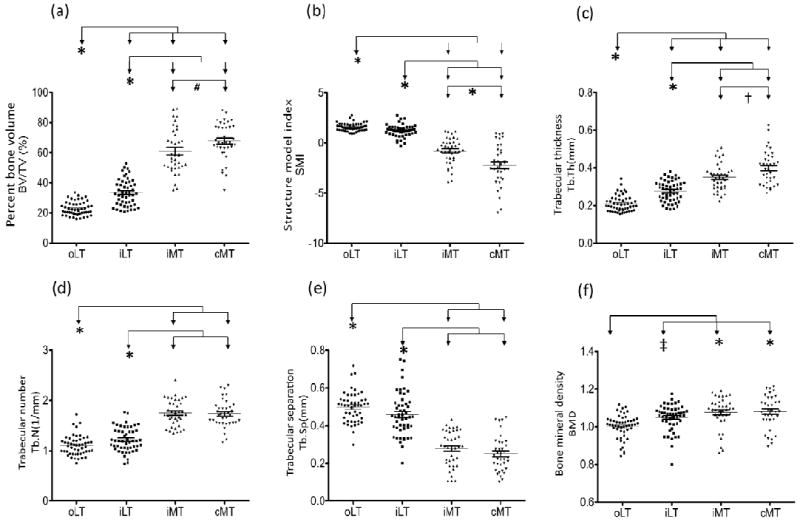
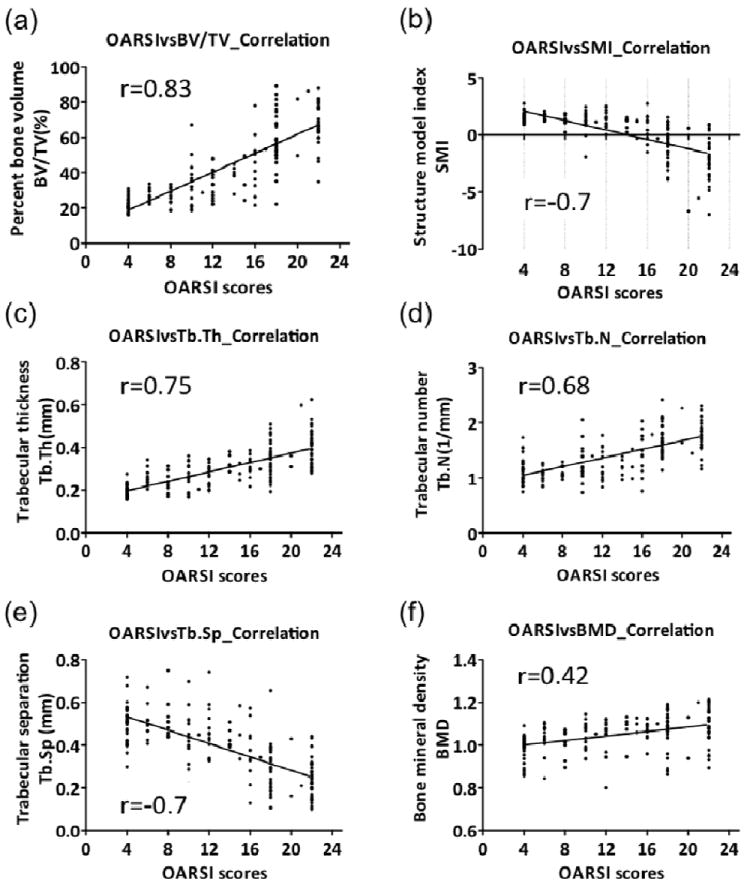
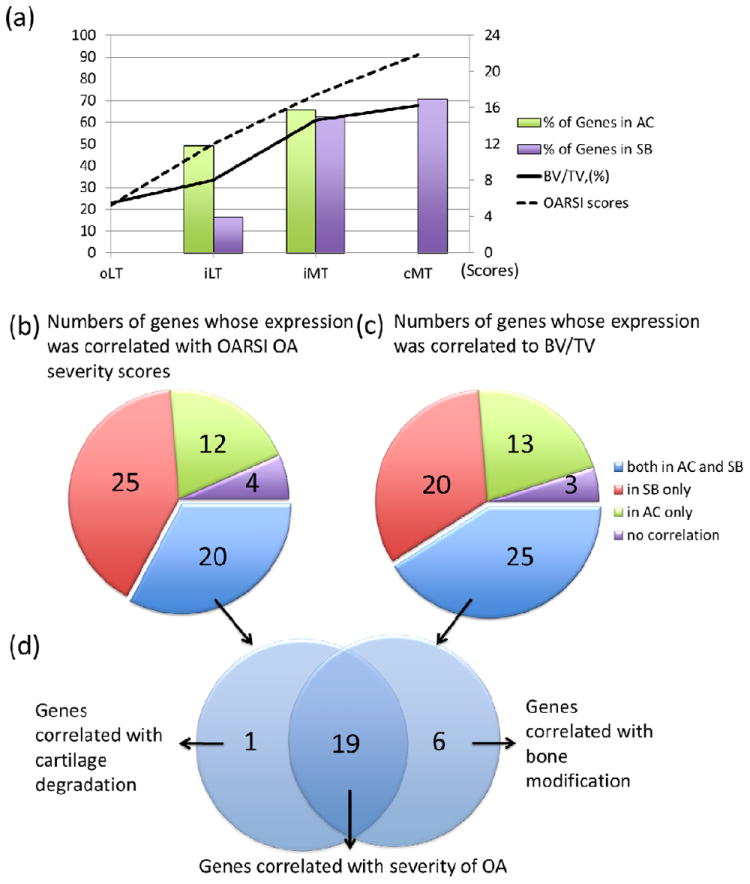
Design: We developed a novel method for isolating site-matched overlying AC and underlying SB from three and four regions of interest respectively from the human knee tibial plateau (n = 50). For each site, the severity of cartilage changes of OA were assessed histologically, and the severity of bone abnormalities were assessed by microcomputed tomography. An RNA isolation procedure was optimized that yielded high quality RNA from site-matched AC and SB tibial regions. Quantitative polymerase chain reaction (Q-PCR) analysis was performed to evaluate gene expression of 61 OA-associated genes for correlation with cartilage integrity and bone structure parameters.

Results: A total of 27 (44%) genes were coordinately up- or down-regulated in both tissues. The expression levels of 19 genes were statistically significantly correlated with the severity of AC degeneration and changes of SB structure; these included: ADAMTS1, ASPN, BMP6, BMPER, CCL2, CCL8, COL5A1, COL6A3, COL7A1, COL16A1, FRZB, GDF10, MMP3, OGN, OMD, POSTN, PTGES, TNFSF11 and WNT1.

Conclusions: These results provide a strategy for identifying targets whose modification may have the potential to ameliorate pathological alterations and progression of disease in both AC and SB simultaneously. In addition, this is the first study, to our knowledge, to overcome the major difficulties related to isolation of high quality RNA from site-matched joint tissues. We expect this method to facilitate advances in our understanding of the coordinated molecular responses of the whole joint organ.


Conflict of interest statement

Competing interests

The authors declare that they have no competing interests.

Figures

Figure 1
Figure 1. Custom tools for joint tissue sectioning and sites of analysis and regions for RNA isolation
(a) The workstation was constructed from commercially available components: (1) a rotary tool holder; (2) a high speed rotary motor, (3) custom adapter, (4) a 90 Angle Adaptor and (5) a 25mm diameter cutting disc of 0.1mm thickness for grinding tissue. (b) Joint tissue bathed in liquid nitrogen (LN) ready for sectioning. (c) Human osteoarthritic knee tibial plateau; the red boxes indicate regions for micro CT and histological analysis at the 4 regions of interest; the dashed boxes demonstrate regions for RNA isolation: (d) outer lateral tibia (oLT); (e) inner lateral tibia (iLT); (f) inner medial tibia (iMT); and the central medial tibia (cMT) devoid of cartilage. Osteophytes were not included in the sampling by the nature of the prespecified locations chosen. Masson stained photomicrographs of AC (left) and site matched SB (right) from the following regions: (g) oLT, (h) iLT, (i) iMT and (j) cMT. (k) Cutting discs, 0.1mm thick, 25mm diameter.
Figure 2
Figure 2. Sectioning and grinding methods for separating overlying AC and underlying SB
(a-b) The custom-made mini bone saw workstation was utilized to section regions of interest in liquid nitrogen. (c) Tissue elements could be clearly distinguished consisting of white overlying articular cartilage (AC) and light pink/yellow underlying subchondral bone (SB). (d) The black arrow depicts a region from which cartilage has been ground off by the high speed rotary grinder. (e) Site-matched SB subsequently ground off below the corresponding overlying AC. (f) An example of the powdered tissue collected by decanting the liquid N2 into a tube for further manipulation. (g-i) Masson staining was performed to illustrate the stages of the procedure through histologic examination of the tissue. Cartilage was stained with blue color and Bone was stained with red color. Original magnification ×10. (k) The entire process was performed in liquid nitrogen and were carried out below -30 °C. (j) Minimal heat was generated by the drilling procedure as demonstrated by thermal imaging. Wolfram vanadium steel milling bits for precision grinding, Ø 2.35mm. (l) PPS-hb (polyurthane resin) tip forceps with low temperature resistance used to stabilize samples during manipulation.
Figure 3
Figure 3. Quantification of underlying subchondral bone parameters of each of the four regions
A total of 6 bone structural parameters were quantified for the 4 regions of interest of SB: (a) percent bone volume (BV/TV); (b) structure model index (SMI); (c) trabecular thickness (Tb.Th); (d) trabecular number (Tb.N); (e) trabecular separation (Tb.Sp); and (f) bone mineral density (BMD). Compared with lateral tibial sites, bone parameters from medial sites exhibited higher BV/TV, Tb.Th Tb.N, and BMD, but lower SMI and Tb.Sp. (oLT: n=50; iLT: n=50; iMT: n=38; cMT: n=36) Each bar represents the mean, and error bars represent SEM. *: P<0.001; #: P = 0.0253; †: P = 0.0069; ‡: P= 0.0114
Figure 4
Figure 4. Pearson’s correlation of OA severity of the overlying AC and structural parameters of the underlying SB
The data for all regions were combined for evaluation of the correlation between OA severity determined by the OARSI grading system, and the 6 bone structure parameters. Significant correlations were observed for OA severity and all the bone parameters: (a) percent bone volume (BV/TV) (r=0.83); (b) structure model index (SMI) (r= -0.7); (c) trabecular thickness (Tb.Th) (r=0.75); (d) trabecular number (Tb.N) (r=0.68); (e) trabecular separation (Tb.Sp) (r=-0.7); and (f) bone mineral density (BMD) (r=0.42).
Figure 5
Figure 5. Genes correlating with OA severity and bone structural alterations
(a) Representation of cartilage degradation, bone volume augmentation and gene involvement in the regions of interest of the human OA knee tibia. Compared with gene expression levels of the oLT region, 30 of 61 and 40 of 61 genes showed significant fold-changes in iLT and iMT regoins in AC. Compared with gene expression levels of the oLT region, 10 of 61, 38 of 61 and 43 of 61 genes in the iLT, iMT and cMT regions showed significant fold-changes in SB. The increasing trends in cartilage loss (OARSI score) and bone structural changes (BV/TV, %) are displayed. (b) 20 of 61 genes were significantly regulated in both AC and SB, and were correlated with cartilage loss. (c) 25 of 61 genes were significantly regulated in both AC and SB, and correlated with structural alterations of the bone. (d) Venn diagram depicting 19 genes that genes correlated with OA severity and bone structural abnormalities including the following: ADAM metallopeptidase with thrombospondin type 1 motif, 14 (ADAMTS14), asporin (ASPN), bone morphogenetic protein 6 (BMP6), BMP binding endothelial regulator (BMPER), chemokine (C-C motif) ligand 2 (CCL2), chemokine (C-C motif) ligand 8 (CCL8), collagen, type V, alpha 1 (COL5A1), collagen, type VI, alpha 3 (COL6A3), collagen, type VII, alpha 1 (COL7A1), collagen, type XVI, alpha 1 (COL16A1), frizzled-related protein (FRZB), growth differentiation factor 10 (GDF10), matrix metallopeptidase 3 (MMP3), osteoglycin (OGN), osteomodulin (OMD), periostin (POSTN), prostaglandin E synthase (PTGES), tumor necrosis factor (ligand) superfamily, member 11 (TNFSF11), and wingless-type MMTV integration site family, member 1 (WNT1).

References

    1. Grynpas MD, Alpert B, Katz I, Lieberman I, Pritzker KP. Subchondral bone in osteoarthritis. Calcif Tissue Int. 1991;49:20–26. - PubMed
    1. Goldring MB, Goldring SR. Articular cartilage and subchondral bone in the pathogenesis of osteoarthritis. Ann N Y Acad Sci. 2010;1192:230–237. - PubMed
    1. Herrero-Beaumont G, Roman-Blas JA, Largo R, Berenbaum F, Castaneda S. Bone mineral density and joint cartilage: four clinical settings of a complex relationship in osteoarthritis. Ann Rheum Dis. 2011;70:1523–1525. - PubMed
    1. Ding C, Cicuttini F, Jones G. Tibial subchondral bone size and knee cartilage defects: relevance to knee osteoarthritis. Osteoarthritis Cartilage. 2007;15:479–486. - PubMed
    1. Kraus VB, Feng S, Wang S, White S, Ainslie M, Brett A, et al. Trabecular morphometry by fractal signature analysis is a novel marker of osteoarthritis progression. Arthritis Rheum. 2009;60:3711–3722. - PMC - PubMed

Publication types