. 2013 Feb;79(4):1134-9.
doi: 10.1128/AEM.03029-12. Epub 2012 Dec 7.

Intercontinental dispersal of bacteria and archaea by transpacific winds

Affiliations

Intercontinental dispersal of bacteria and archaea by transpacific winds

David J Smith et al. Appl Environ Microbiol. 2013 Feb.

Abstract

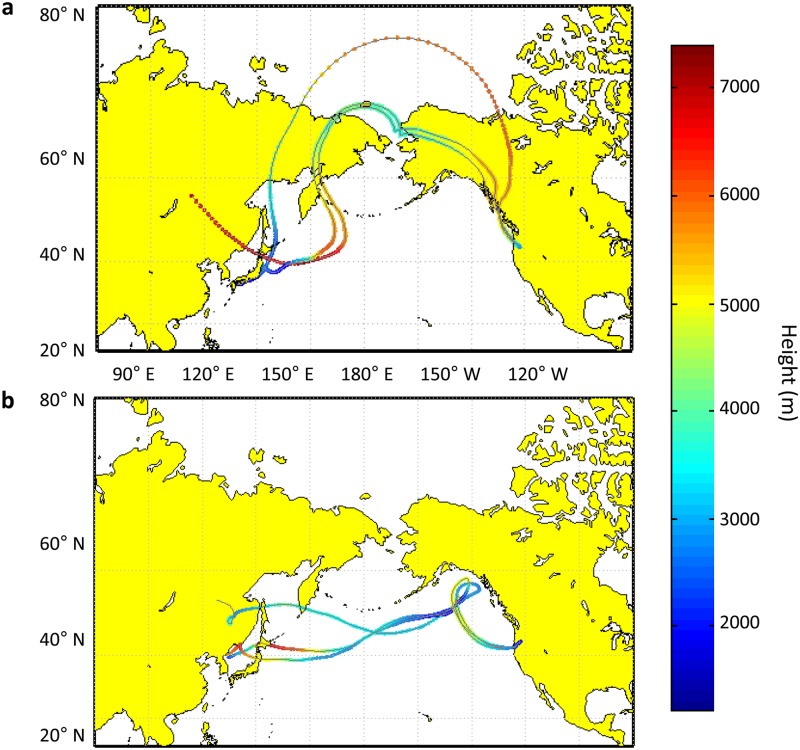
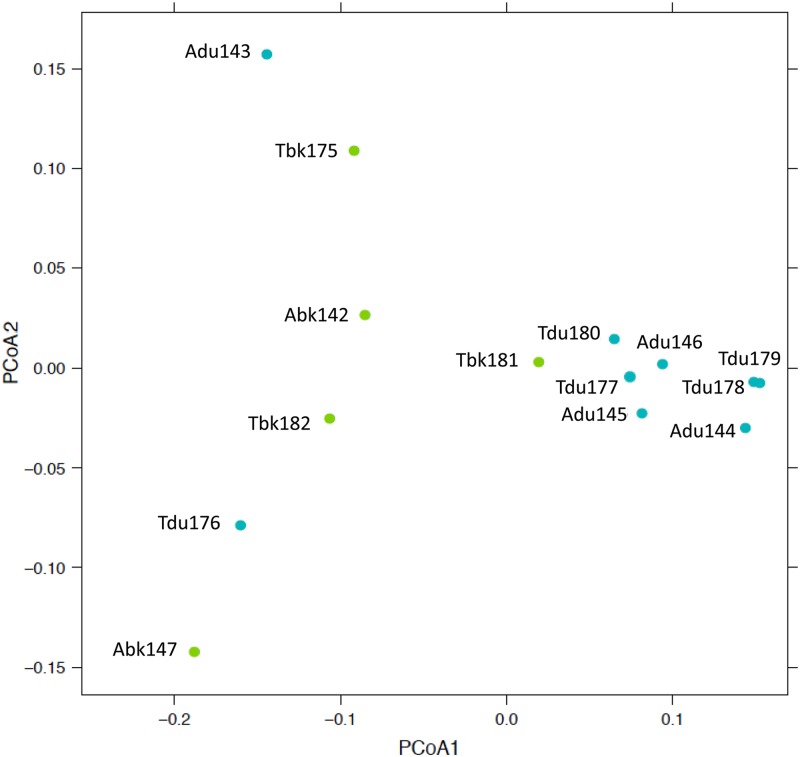
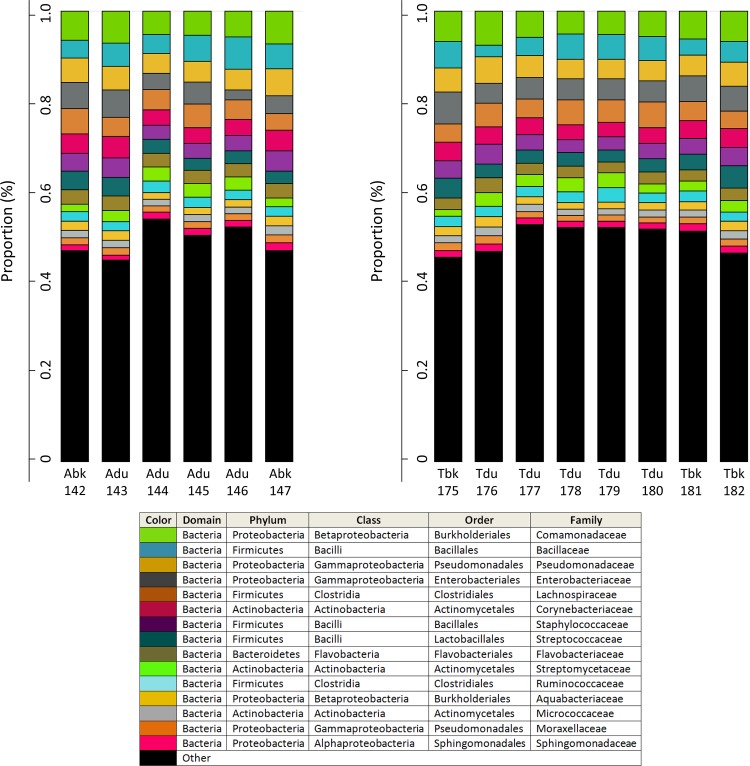
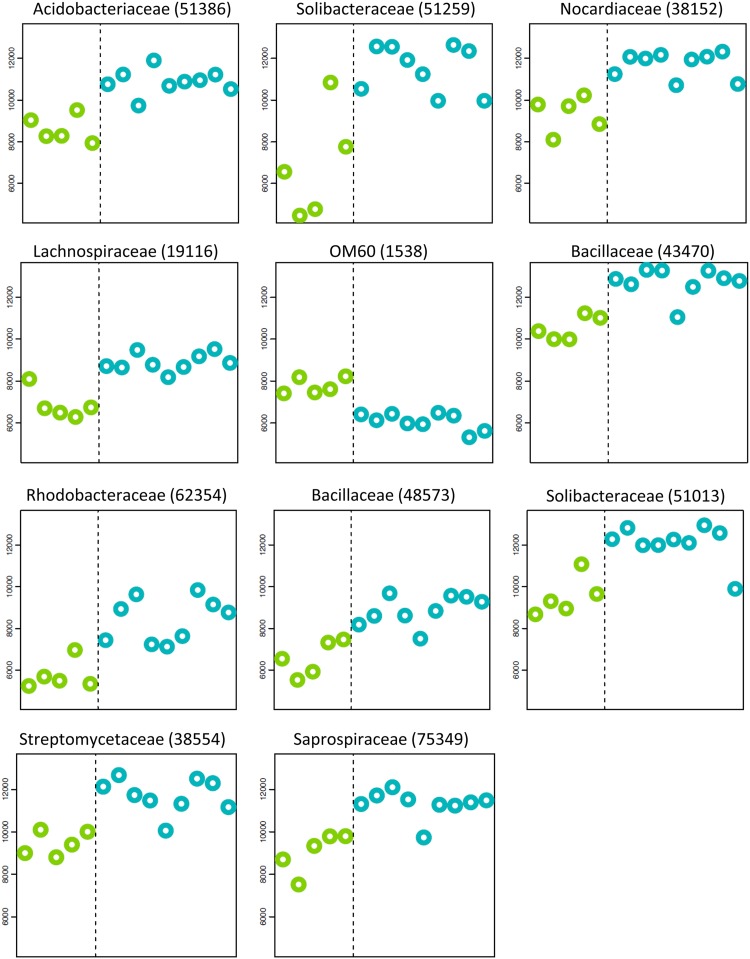
Microorganisms are abundant in the upper atmosphere, particularly downwind of arid regions, where winds can mobilize large amounts of topsoil and dust. However, the challenge of collecting samples from the upper atmosphere and reliance upon culture-based characterization methods have prevented a comprehensive understanding of globally dispersed airborne microbes. In spring 2011 at the Mt. Bachelor Observatory in North America (2.8 km above sea level), we captured enough microbial biomass in two transpacific air plumes to permit a microarray analysis using 16S rRNA genes. Thousands of distinct bacterial taxa spanning a wide range of phyla and surface environments were detected before, during, and after each Asian long-range transport event. Interestingly, the transpacific plumes delivered higher concentrations of taxa already in the background air (particularly Proteobacteria, Actinobacteria, and Firmicutes). While some bacterial families and a few marine archaea appeared for the first and only time during the plumes, the microbial community compositions were similar, despite the unique transport histories of the air masses. It seems plausible, when coupled with atmospheric modeling and chemical analysis, that microbial biogeography can be used to pinpoint the source of intercontinental dust plumes. Given the degree of richness measured in our study, the overall contribution of Asian aerosols to microbial species in North American air warrants additional investigation.


Figures

Fig 1
Fig 1
Ten-day kinematic back trajectories for air arriving at MBO (43.98°N, 121.7°W), depicting transpacific transport patterns from Asia (left) to North America (right). Back trajectories for both episodes were calculated using the HYSPLIT model at the peak plume hour (highest aerosol, CO, and O3 levels). The colored scale bar represents trajectory height (m above sea level). (a) Trajectories ending 22 April 2011 at 12:00 UTC, showing a rapid ascent to the upper troposphere/lower stratosphere prior to sampling; (b) trajectories ending 13 May 2011 at 00:00 UTC, showing possible marine boundary layer mixing and a storm loop off the Alaskan coast prior to sampling.
Fig 2
Fig 2
Principle coordinate analysis of background samples (green) and plume samples (blue). Analysis was based on the unweighted UniFrac distance between samples from 38,546 possible taxa with incidence differences. For axis 1, 29% of the variation was explained; for axis 2, 9% of the variation was explained. The partitioning shows the similarity in community composition between plume samples (abbreviated du) and the similarity in community composition background samples (abbreviated bk), regardless of plume timing (April or May). Note that Adu143 and Tdu176 were transitional samples at the onset of a plume (i.e., a mixture of background and plume).
Fig 3
Fig 3
Relative abundance of 15 common bacterial families across the April plume (left) and May plume (right). The size of each color block (assigned to families in the table below) represents the number of OTUs detected in the family relative to the total number of OTUs detected in that sample. For example, Bacillaceae OTUs accounted for 6.5% of the total OTUs detected in the first April sample (Abk142). Generally, family proportions remained constant across both episodes.
Fig 4
Fig 4
Significant abundance variations in specific taxa between background (green) and plume (blue) periods. Combined data for April and May events are shown. HybScores are on the y axis, and the sample order (from left to right) follows the order used in Tables 1 and 2 (e.g., Abk142 is the leftmost data point). Numbers in parentheses are OTU identification numbers.

References

    1. Burrows SM, Elbert W, Lawrence MG, Pöschl U. 2009. Bacteria in the global atmosphere. Part 1. Review and synthesis of literature data for different ecosystems. Atmos. Chem. Phys. 9:9263–9280
    1. Fahlgren C, Hagström A, Nilsson D, Zweifel UL. 2010. Annual variations in the diversity, viability, and origin of airborne bacteria. Appl. Environ. Microbiol. 76:3015–3025 - PMC - PubMed
    1. Brodie EL, DeSantis TZ, Moberg Parker JP, Zubietta IX, Piceno YM, Anderson GL. 2007. Urban aerosols harbor diverse and dynamic bacterial populations. Proc. Natl. Acad. Sci. U. S. A. 104:299–304 - PMC - PubMed
    1. Weiss-Penzias P, Jaffe DA, Swartzendruber P, Dennison JB, Chand D, Hafner W, Prestbo E. 2006. Observations of Asian air pollution in the free troposphere at Mount Bachelor Observatory during the spring of 2004. J. Geophys. Res. 111:D10304 doi:10.1029/2005JD006522 - DOI
    1. Christner BC, Morris CE, Foreman CM, Cai R, Sands DC. 2008. Ubiquity of biological nice nucleators in snowfall. Science 319:1214. - PubMed

Publication types

Substances

LinkOut - more resources