

A mathematical model to study the dynamics of epithelial cellular networks
- PMID: 23221083
- PMCID: PMC3558995
- DOI: 10.1109/TCBB.2012.126
A mathematical model to study the dynamics of epithelial cellular networks
Abstract
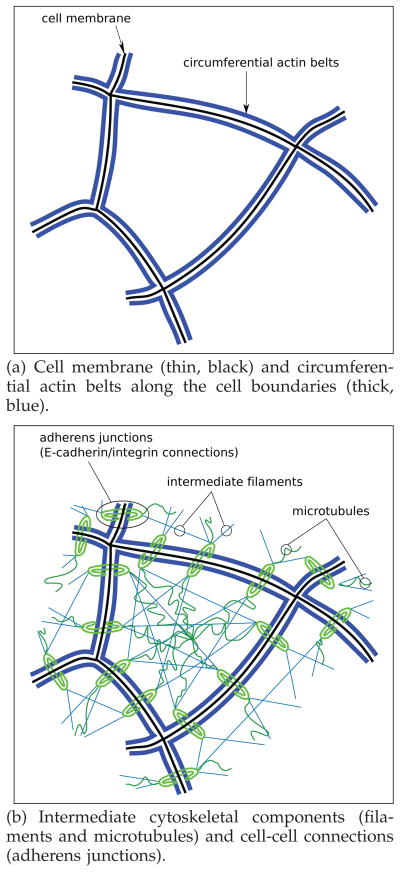
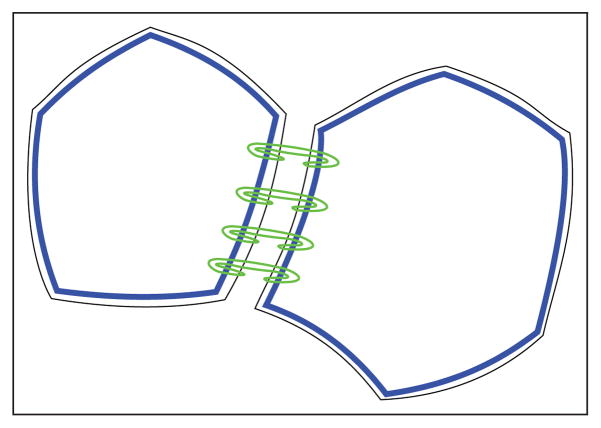
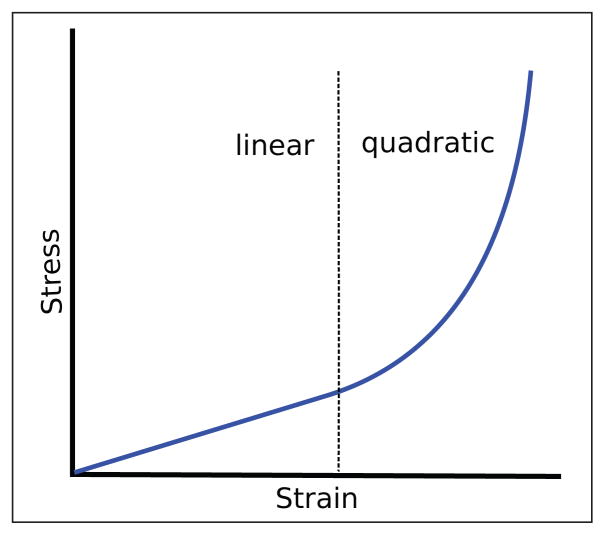
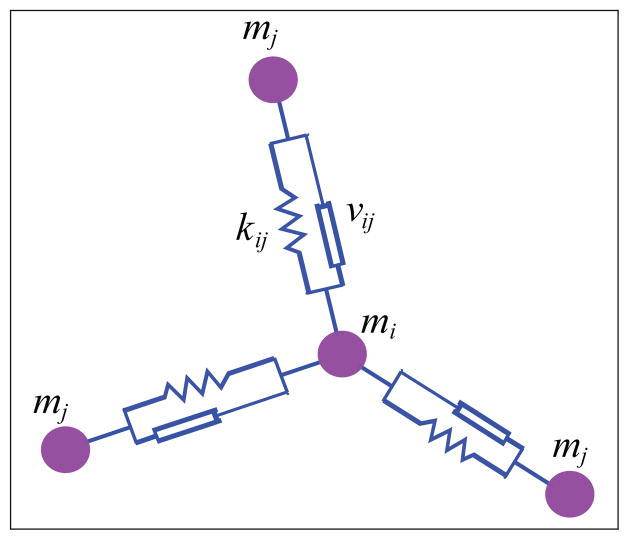
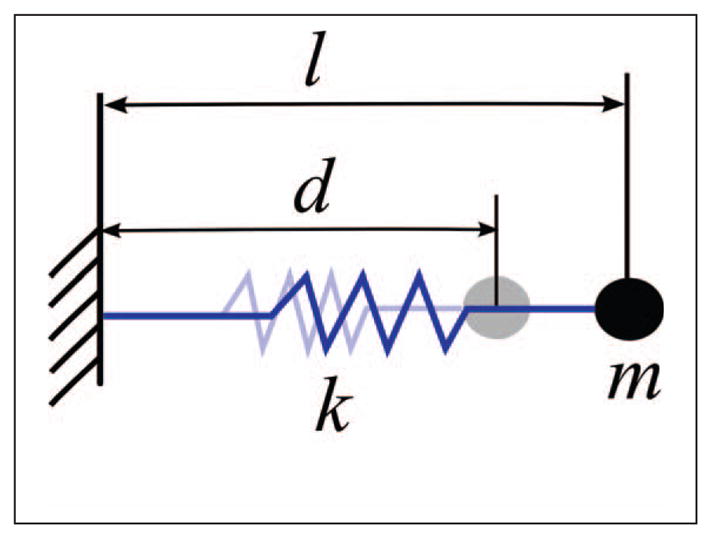
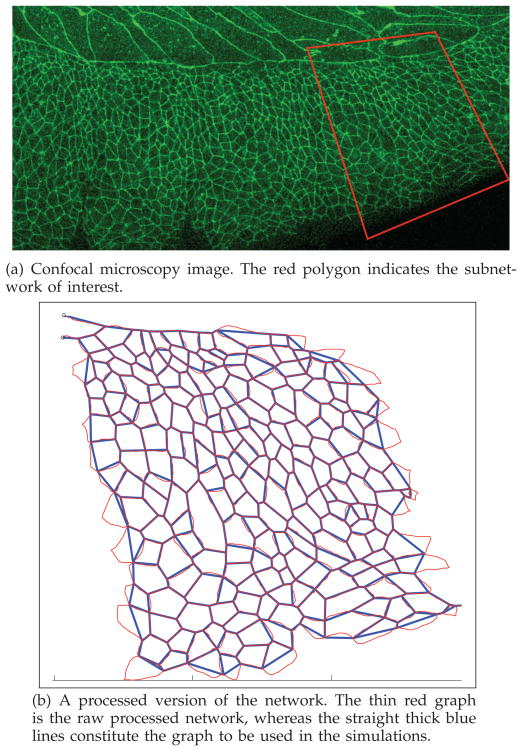
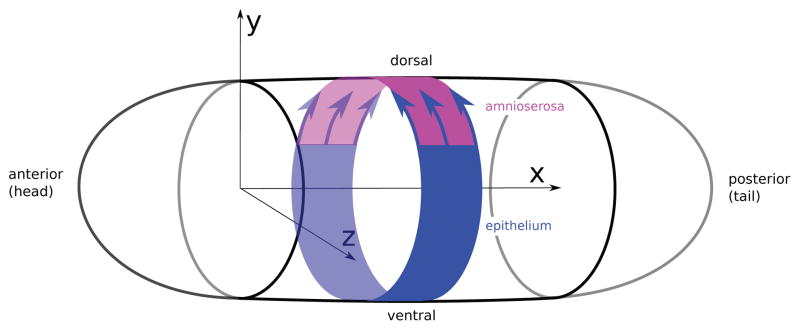
Epithelia are sheets of connected cells that are essential across the animal kingdom. Experimental observations suggest that the dynamical behavior of many single-layered epithelial tissues has strong analogies with that of specific mechanical systems, namely large networks consisting of point masses connected through spring-damper elements and undergoing the influence of active and dissipating forces. Based on this analogy, this work develops a modeling framework to enable the study of the mechanical properties and of the dynamic behavior of large epithelial cellular networks. The model is built first by creating a network topology that is extracted from the actual cellular geometry as obtained from experiments, then by associating a mechanical structure and dynamics to the network via spring-damper elements. This scalable approach enables running simulations of large network dynamics: the derived modeling framework in particular is predisposed to be tailored to study general dynamics (for example, morphogenesis) of various classes of single-layered epithelial cellular networks. In this contribution, we test the model on a case study of the dorsal epithelium of the Drosophila melanogaster embryo during early dorsal closure (and, less conspicuously, germband retraction).
Figures
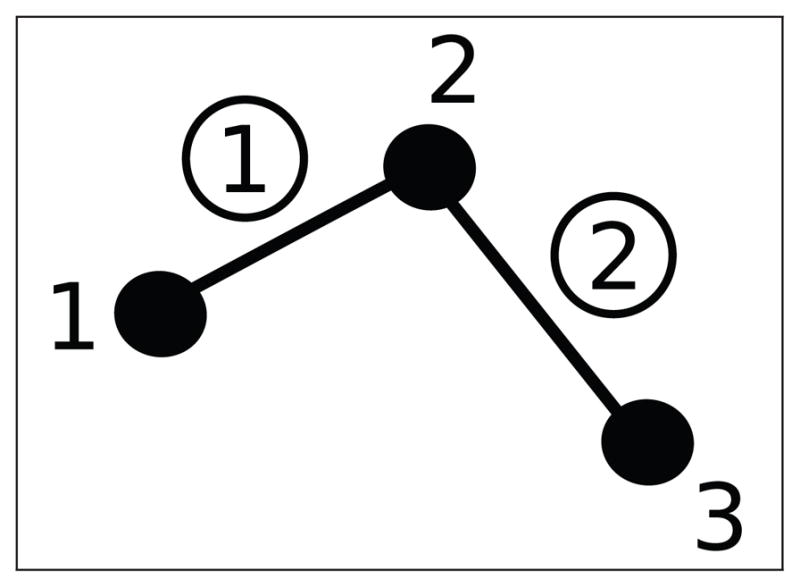
 . Loose numbers denote vertices, whereas circled numbers denote edges.
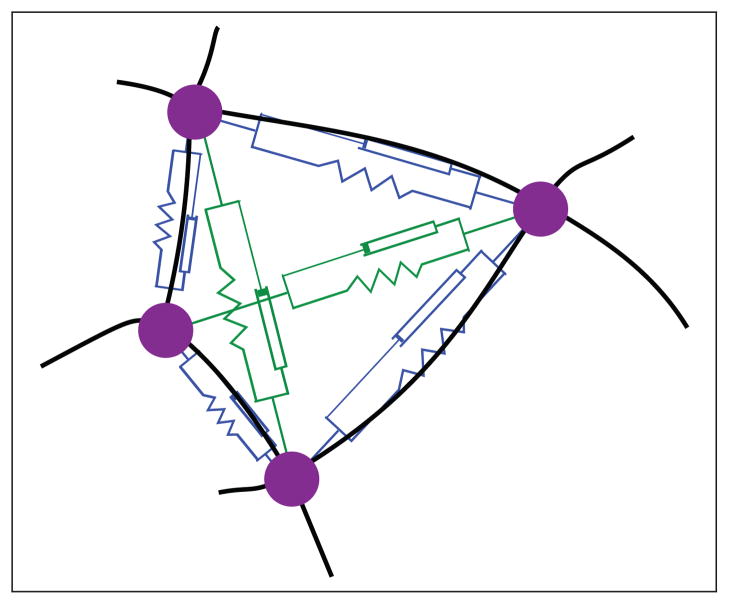
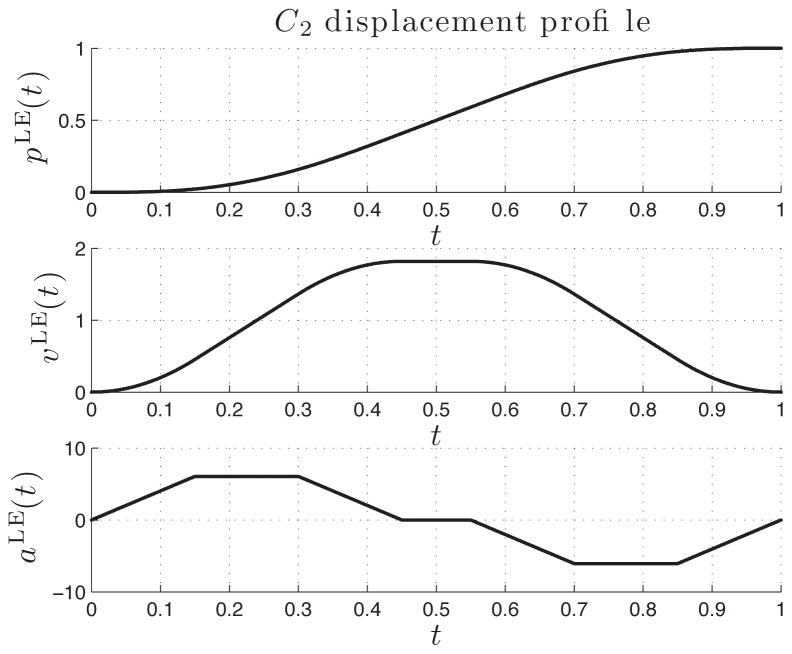
 trajectory imposed on the leading edge vertices. Top down displacement profile pLE(t), velocity profile vLE(t), and acceleration profile aLE(t). The time axis has been normalized.
References
-
- Boal D. Mechanics of the Cell. Cambridge University Press; 2011.
-
- Alexander R, Anderson M, Chaplain, KR, editors. Single-cell-based Models in Biology and Medicine. Springer Verlag; 2007.
-
- Solon J, Kaya-Copur A, Colombelli J, Brunner D. Pulsed forces timed by a ratchet-like mechanism drive directed tissue movement during dorsal closure. Cell. 2009;137(7):1331–1342. - PubMed
Publication types
MeSH terms
Grants and funding
LinkOut - more resources
Full Text Sources
Molecular Biology Databases
