

Gauging the likelihood of stable cavitation from ultrasound contrast agents
- PMID: 23221109
- PMCID: PMC4467591
- DOI: 10.1088/0031-9155/58/1/127
Gauging the likelihood of stable cavitation from ultrasound contrast agents
Abstract
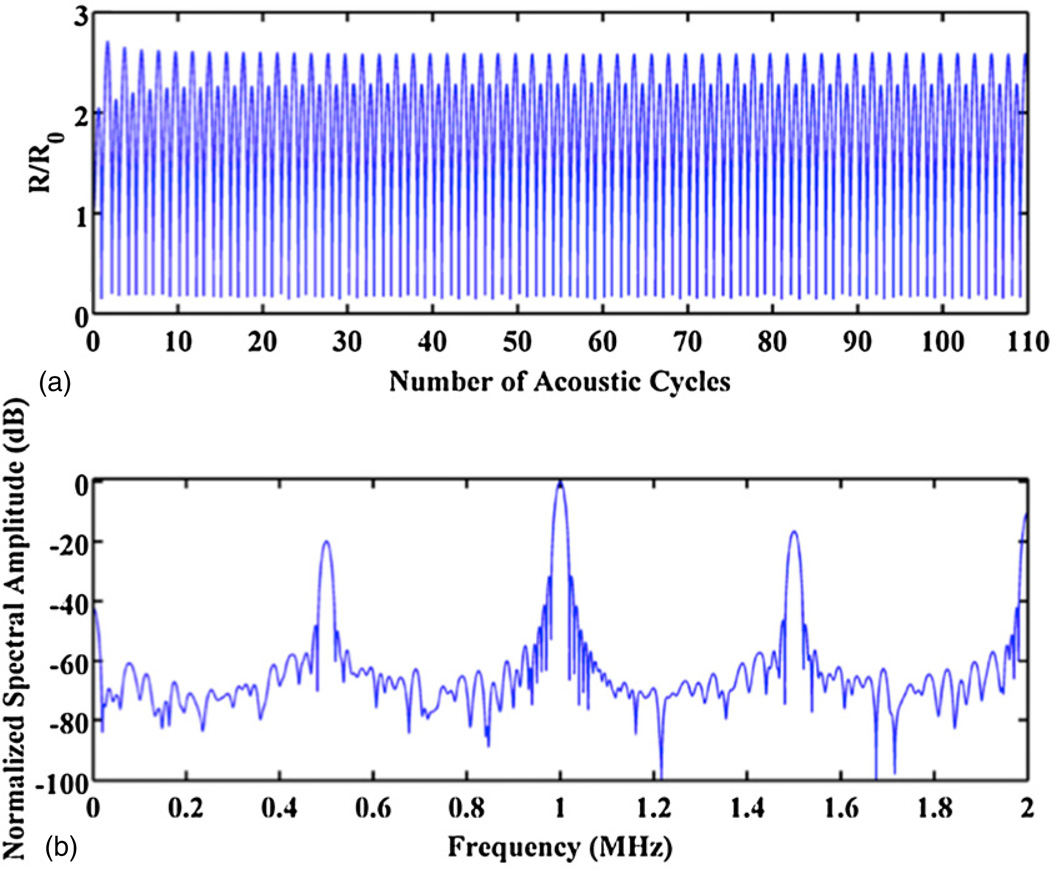
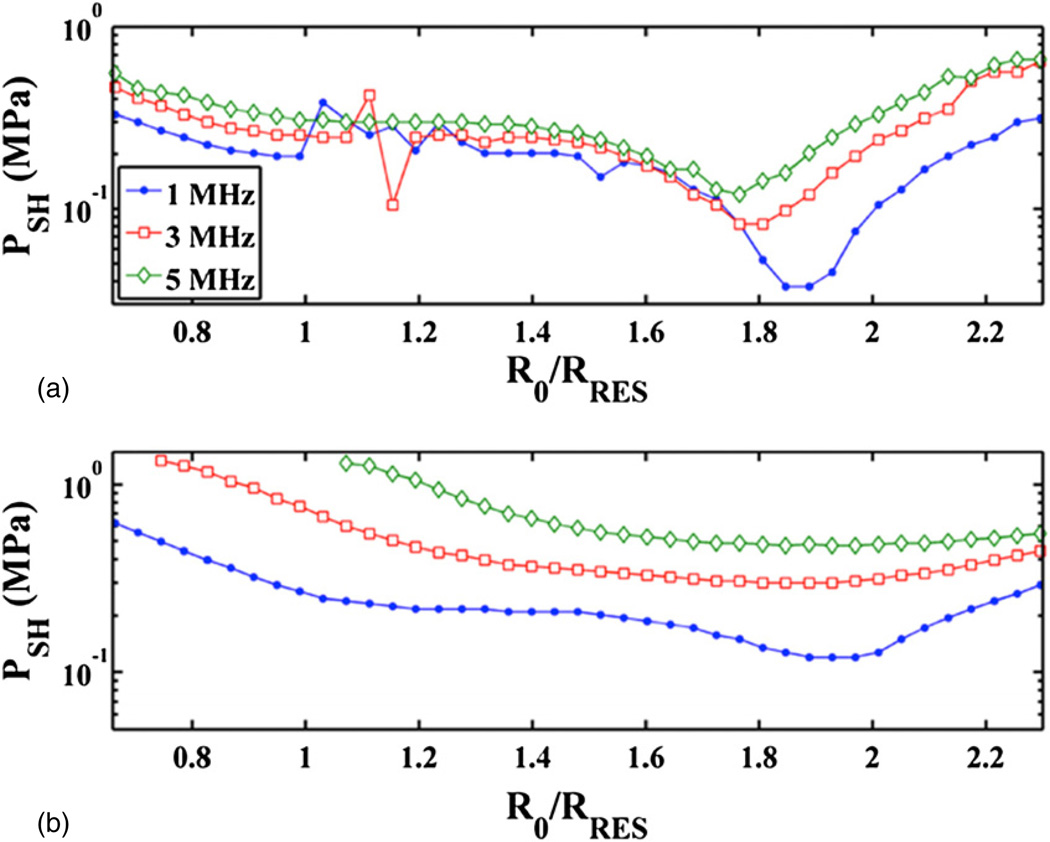
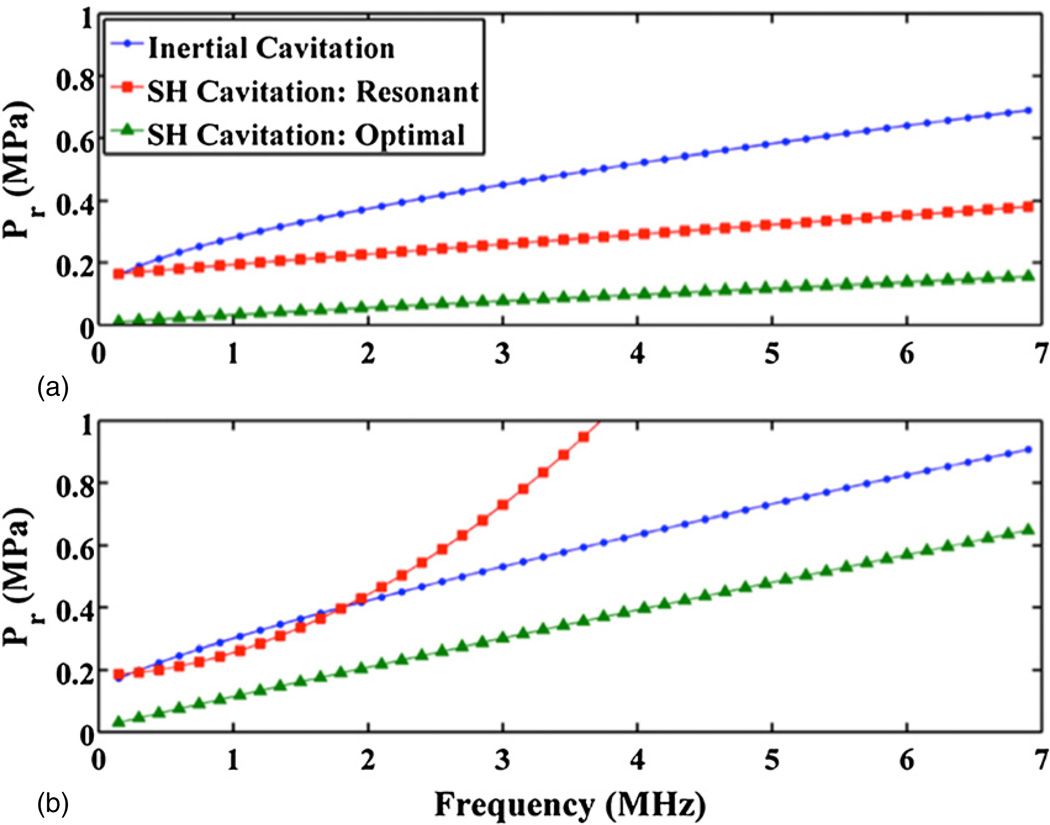
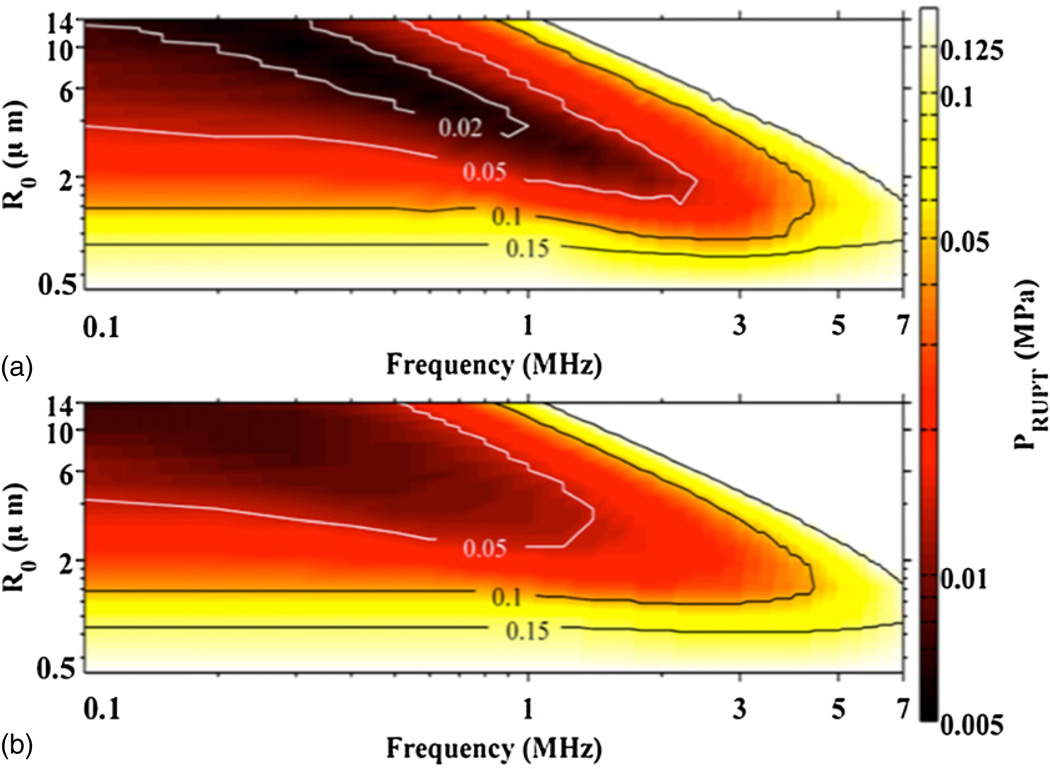
The mechanical index (MI) was formulated to gauge the likelihood of adverse bioeffects from inertial cavitation. However, the MI formulation did not consider bubble activity from stable cavitation. This type of bubble activity can be readily nucleated from ultrasound contrast agents (UCAs) and has the potential to promote beneficial bioeffects. Here, the presence of stable cavitation is determined numerically by tracking the onset of subharmonic oscillations within a population of bubbles for frequencies up to 7 MHz and peak rarefactional pressures up to 3 MPa. In addition, the acoustic pressure rupture threshold of an UCA population was determined using the Marmottant model. The threshold for subharmonic emissions of optimally sized bubbles was found to be lower than the inertial cavitation threshold for all frequencies studied. The rupture thresholds of optimally sized UCAs were found to be lower than the threshold for subharmonic emissions for either single cycle or steady state acoustic excitations. Because the thresholds of both subharmonic emissions and UCA rupture are linearly dependent on frequency, an index of the form I(CAV) = P(r)/f (where P(r) is the peak rarefactional pressure in MPa and f is the frequency in MHz) was derived to gauge the likelihood of subharmonic emissions due to stable cavitation activity nucleated from UCAs.
Figures
 (Greenleaf et al 1998),
  (Juffermans et al 2009),
  (Rahim et al 2006),
  (Miller and Dou 2004)), thrombolysis (
 (Datta et al 2008),
  (Prokop et al 2007),
  (Porter et al 2001),
  (Petit et al 2012)), drug delivery (
 (Hitchcock et al 2010),
  (McDannold et al 2008)), and petechial hemorrhage (
 (Miller et al 2008)) are also shown.
References
-
- Adam D, Sapunar M, Burla E. On the relationship between encapsulated ultrasound contrast agent and pressure. Ultrasound Med. Biol. 2005;31:673–686. - PubMed
-
- AIUM. Standard for Real-Time Display of Thermal and Mechanical Acoustic Output Indices on Diagnostic Ultrasound Equipment Revision 2. 2004
-
- Akulichev VA. Pulsations of cavitation voids. In: Rozenberged LD, editor. High-Intensity Ultrasonic Fields. New York: Plenum; 1971. pp. 239–259.
-
- Ammi AY. PhD Thesis. Université Paris VI; 2006. Détection et caractérisation de la destruction des microbulles de produit de contraste ultrasonore.
Publication types
MeSH terms
Substances
Grants and funding
LinkOut - more resources
Full Text Sources
Other Literature Sources
Research Materials