. 2013 Jan;123(1):236-46.
doi: 10.1172/JCI63679. Epub 2012 Dec 10.

Calcium oxalate crystals induce renal inflammation by NLRP3-mediated IL-1β secretion

Affiliations

Calcium oxalate crystals induce renal inflammation by NLRP3-mediated IL-1β secretion

Shrikant R Mulay et al. J Clin Invest. 2013 Jan.

Abstract

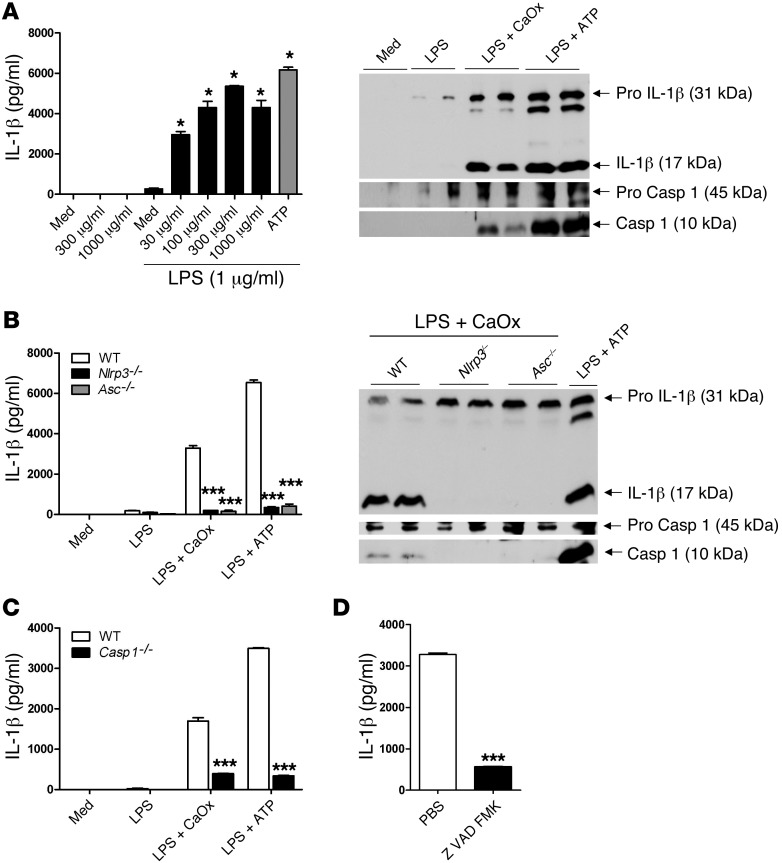
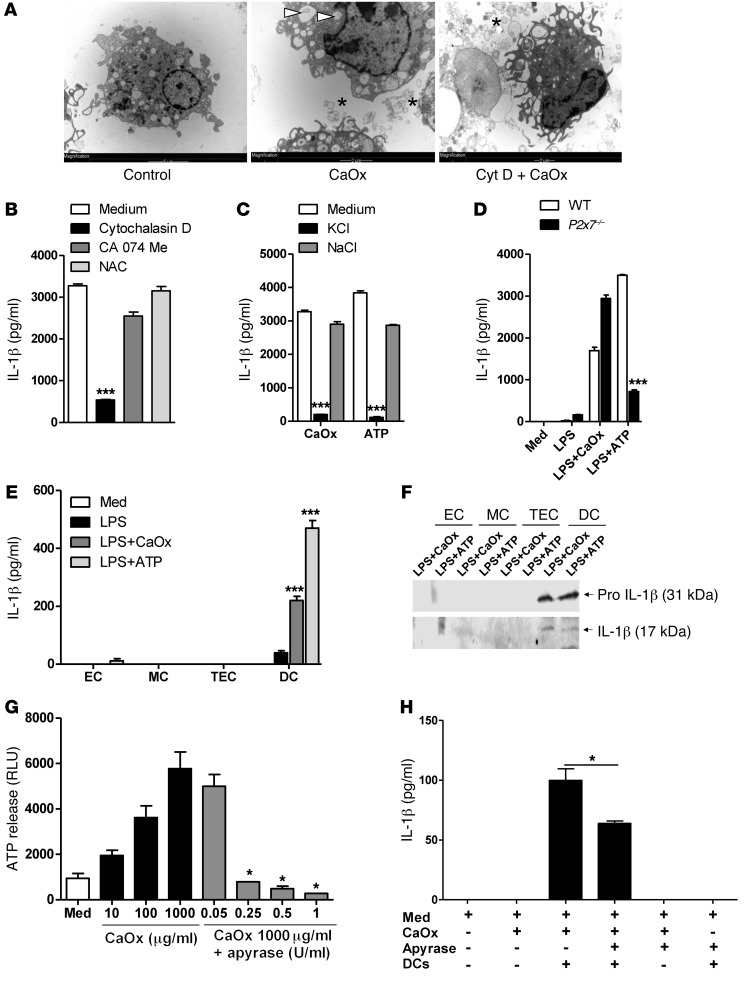
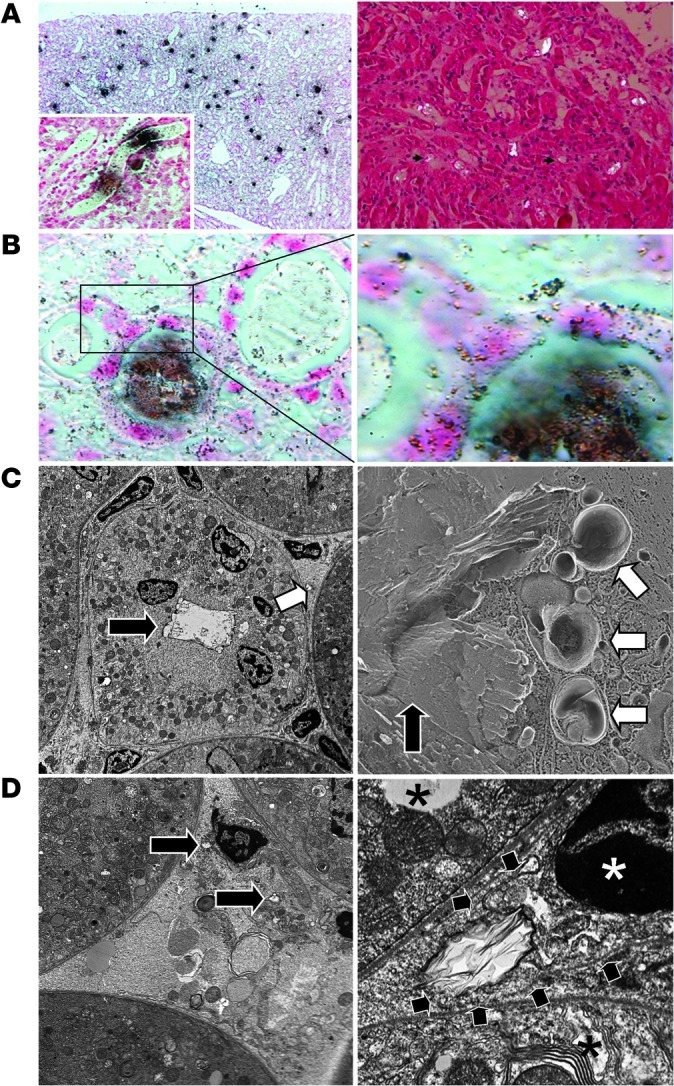
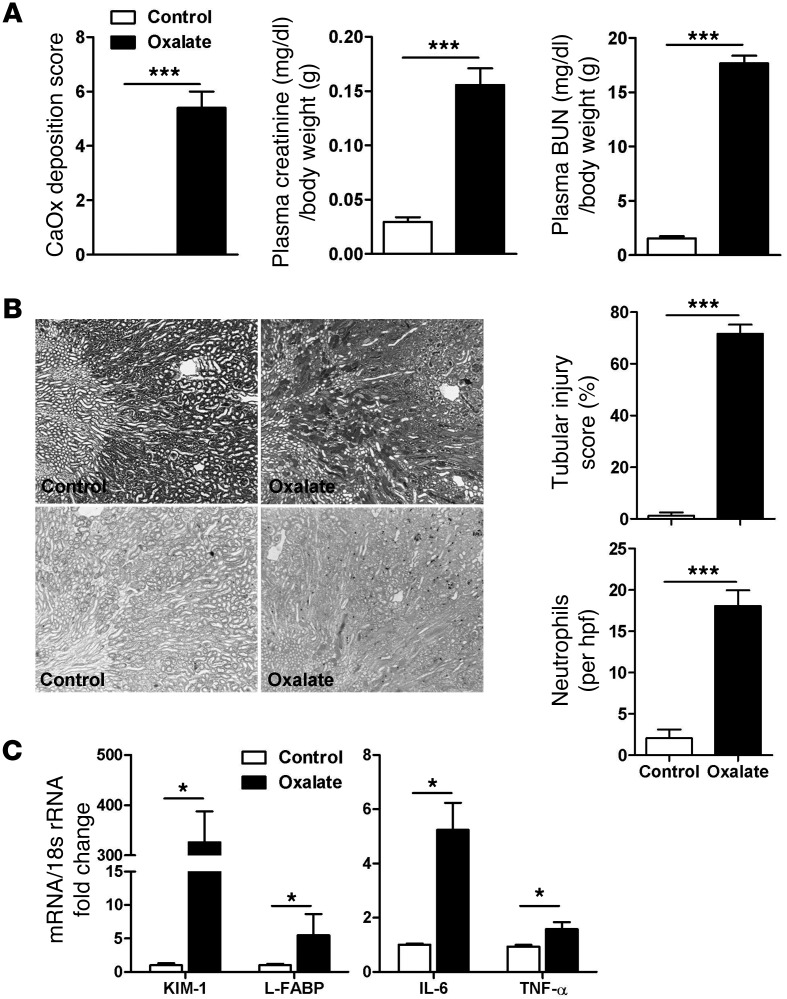
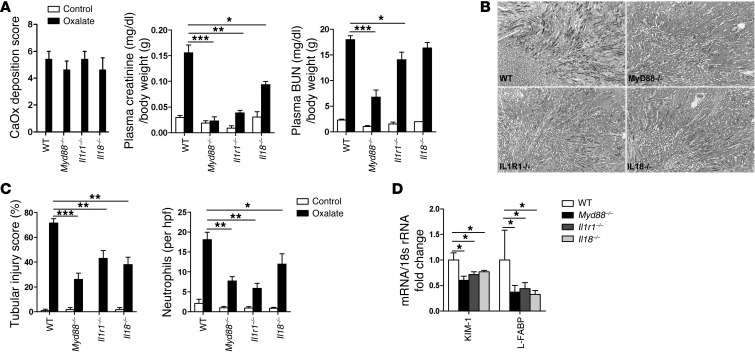
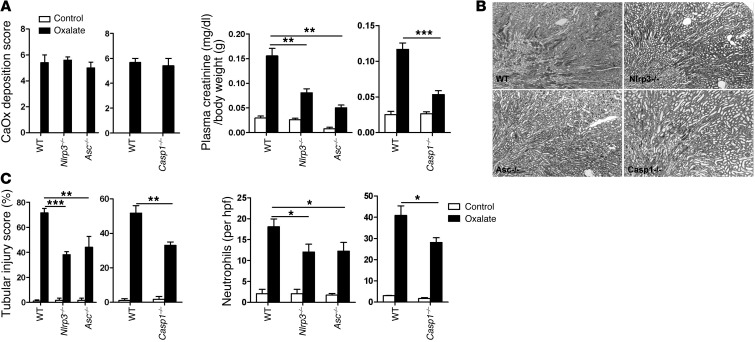
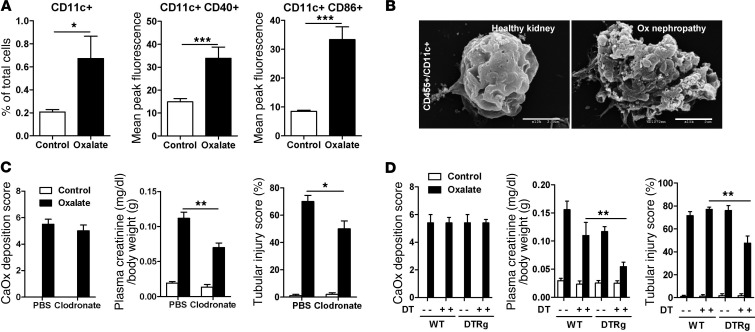
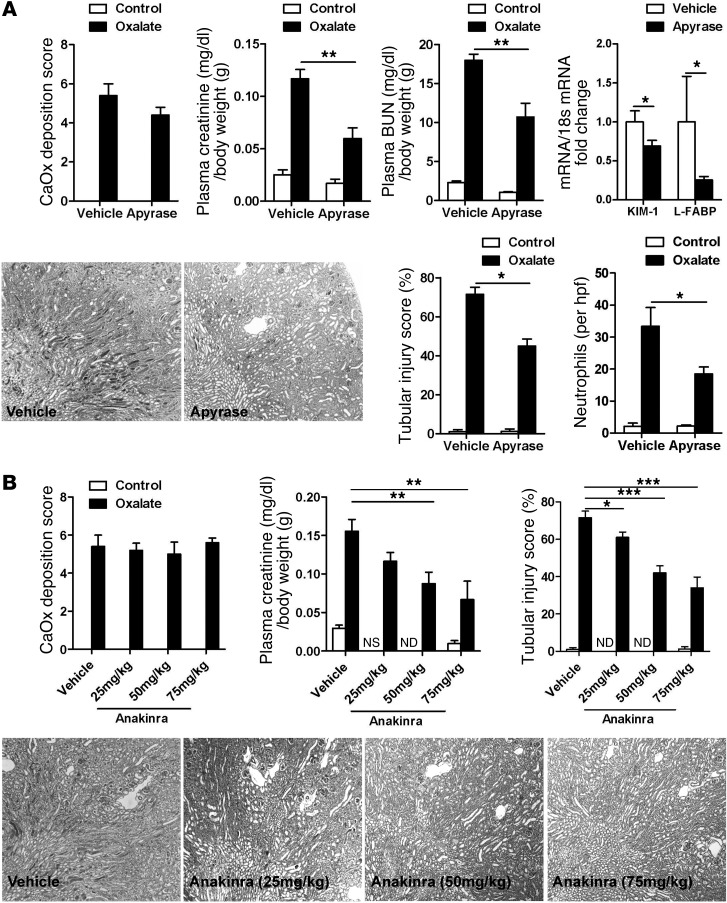
Nephrocalcinosis, acute calcium oxalate (CaOx) nephropathy, and renal stone disease can lead to inflammation and subsequent renal failure, but the underlying pathological mechanisms remain elusive. Other crystallopathies, such as gout, atherosclerosis, and asbestosis, trigger inflammation and tissue remodeling by inducing IL-1β secretion, leading us to hypothesize that CaOx crystals may induce inflammation in a similar manner. In mice, intrarenal CaOx deposition induced tubular damage, cytokine expression, neutrophil recruitment, and renal failure. We found that CaOx crystals activated murine renal DCs to secrete IL-1β through a pathway that included NLRP3, ASC, and caspase-1. Despite a similar amount of crystal deposits, intrarenal inflammation, tubular damage, and renal dysfunction were abrogated in mice deficient in MyD88; NLRP3, ASC, and caspase-1; IL-1R; or IL-18. Nephropathy was attenuated by DC depletion, ATP depletion, or therapeutic IL-1 antagonism. These data demonstrated that CaOx crystals trigger IL-1β-dependent innate immunity via the NLRP3/ASC/caspase-1 axis in intrarenal mononuclear phagocytes and directly damage tubular cells, leading to the release of the NLRP3 agonist ATP. Furthermore, these results suggest that IL-1β blockade may prevent renal damage in nephrocalcinosis.


Figures

Figure 1
Figure 1. CaOx crystals activate DCs to secrete mature IL-1β.
(A) WT BMDCs were stimulated with increasing doses of CaOx crystals with or without LPS prestimulation (1 μg/ml), and IL-1β secretion was measured by ELISA. ATP served as a positive control of NLRP3 activation. Western blotting of supernatants showed induction of pro–IL-1β by LPS; only CaOx crystals and ATP induced mature IL-1β secretion. This process involved caspase-1 activation (cleavage product, 10 kDa). (B) DCs from WT, Nlrp3–/–, and Asc–/– mice. CaOx crystal– and ATP-induced IL-1β secretion depended on the presence of NLRP3 and ASC regardless of pro–IL-1β induction. (C) Similar results were obtained in DCs isolated from Casp1–/– mice. (D) WT BMDCs were stimulated with LPS/CaOx with or without the caspase inhibitor Z-VAD-FMK. Data are means ± SD from 3 separate experiments. *P < 0.05 vs. medium; ***P < 0.001 vs. respective WT (B and C) or PBS (D).
Figure 2
Figure 2. Mechanisms of CaOx crystal–induced IL-1β secretion.
(A) BMDCs were primed with LPS (1 μg/ml) and stimulated with CaOx crystals in the presence or absence of cytochalasin D. TEM showed that CaOx crystals appeared outside the cell (asterisks) and inside intracellular endosomes (arrowheads), whereas cytochalasin D treatment inhibited their uptake in DCs. (B) Incubation with cytochalasin D, CA074Me, and N-acetyl cysteine (NAC) affected IL-1β secretion, measured by ELISA in cell culture supernatants after 6 hours. (C) Similar experiments were performed using 75 mM KCl in cell culture medium to block potassium efflux from the DCs. NaCl of an identical molarity was used as a molarity control. High extracellular potassium prevented CaOx-induced IL-1β secretion. (D) DCs were isolated from WT and P2x7–/– mice. ATP-induced, but not CaOx-induced, IL-1β secretion depended on the presence of P2X7. Data are means ± SD from 3 independent experiments. (E) Renal ECs, MCs, TECs, and renal DCs were primed with LPS and exposed to CaOx crystals, and IL-1β secretion was measured. ATP was used as a positive control for NLRP3 activation. (F) Western blotting. LPS priming induced pro–IL-1β expression only in DCs. (G) Primary TECs were isolated from WT mice and cultured with increasing concentrations of CaOx. ATP release was quantified in cell culture supernatant upon 18 hours of CaOx crystal exposure with and without increasing concentrations of apyrase. (H) Coculture of LPS-primed DCs with CaOx (100 μg/ml) damaged TECs with or without apyrase (1 U/ml). IL-1β secretion was measured by ELISA after 24 hours. Data are means ± SD from 3 independent experiments. *P < 0.05, **P < 0.01, ***P < 0.001 vs. medium (B, C, and E); vs. WT (D); vs. 1,000 μg/ml CaOx alone (G); or as indicated by brackets.
Figure 3
Figure 3. CaOx nephropathy in C57BL/6 mice.
(A) Kidney sections showed CaOx crystals distributed throughout, especially in the tubular lumina (Pizzolato stain; left) or viewed under polarized light (right). Original magnification, ×100 (left); ×200 (right); ×400 (inset). (B) At higher magnification, Pizzolato stain showed smaller (granular) crystals inside TECs as well as in the renal interstitial compartment. Original magnification, ×400 (left), ×1,000 (right). (C) TEM (left) confirmed large CaOx crystal aggregates within the tubular lumen (black arrow) as well as in the interstitial space (white arrow). Freeze-fracture EM (right) identified CaOx crystals in the tubular lumen (black arrow) as well as inside cytoplasmic organelles, some of which appeared to be lysosomes (white arrows). Original magnification, ×3,000. (D) TEM also showed CaOx crystals within the interstitial compartment in close proximity to interstitial cells (left; black arrows). At higher magnification (right), an interstitial cell (white asterisk indicates nucleus) engulfed a CaOx crystal (black arrows denote outer cell membrane); neighboring TECs are denoted by black asterisks. Original magnification, ×7,000 (left); ×25,000 (right).
Figure 4
Figure 4. Oxalate nephropathy in C57BL/6 mice.
(A) Oxalate feeding caused diffuse oxalate deposition within 24 hours and significantly increased plasma creatinine levels and BUN levels. (B) PAS staining illustrated tubular necrosis, which was quantified by semiquantitative scoring (loss of brush border, flattening of cells, disruption and detachment of tubular cells from basement membranes). Renal neutrophil counts were determined by Ly6G B1.2 immunostaining and quantified per 15 hpfs. Original magnification, ×100. (C) Renal mRNA expression was determined by real-time RT-PCR. Data are means ± SEM from 5–6 mice per group. *P < 0.05, ***P < 0.001.
Figure 5
Figure 5. Role of MyD88, IL-1R, and IL-18 in CaOx nephropathy.
(A) Oxalate deposition was similar in Myd88–/–, Il1r–/–, and Il18–/– mice, but plasma creatinine levels and BUN were not significantly increased, suggesting a protective role of these molecules in CaOX-induced renal damage. (B) PAS staining illustrated tubular necrosis. Original magnification, ×100. (C) Tubular injury score was determined by semiquantitative scoring, and renal neutrophil counts were determined by immunostaining and quantified per hpf. Data are means ± SEM from 5–6 mice per group. *P < 0.05, **P < 0.01, ***P < 0.001.
Figure 6
Figure 6. Role of NLRP3, ASC, and caspase-1 in CaOx nephropathy.
(A) Nlrp3–/–, Asc–/–, and Casp1–/– mice showed CaOx deposits similar to those of WT mice, but decreased creatinine levels. (B) PAS staining illustrated reduced tubular necrosis compared with WT. Original magnification, ×100. (C) Tubular injury score and white cell counts were also reduced compared with WT. Data are means ± SEM from 5–6 mice per group. *P < 0.05, **P < 0.01, ***P < 0.001.
Figure 7
Figure 7. Role of DCs in CaOx nephropathy.
CD45+CD11c+ cells were extracted from C57BL/6 by magnetic beads and sorted by flow cytometry using antibodies for the activation markers CD40 and MHC class II. (A) Percentage of cells with the specific markers. (B) CD45+CD11c+ cells were examined by scanning EM. DCs from CaOx mice showed marked cell surface disruption compared with the smooth bosselated surface of control cells. Scale bars: 2.5 μm. (C) CaOx nephropathy was induced in mice depleted of DCs (pretreated with clodronate liposomes) and compared with that in mice treated with control liposomes. (D) The same analyses were performed in CD11c DTRg mice in which CD11c+ cells were depleted by diphtheria toxin (DT) injection. Data are means ± SEM from 5–6 mice per group. *P < 0.05, **P < 0.01, ***P < 0.001.
Figure 8
Figure 8. Apyrase and anakinra treatment in CaOx nephropathy in C57BL/6 mice.
Oxalate nephropathy was induced in C57BL/6 mice treated with or without apyrase (A) and anakinra (B), and oxalate deposition was quantified using Pizzolato stains. Plasma creatinine levels were determined as described in Methods. Tubular injury score was determined by semiquantitative scoring of PAS sections, and renal neutrophil counts were determined by immunostaining and quantified per hpf. Original magnification, ×100. Data are means ± SEM from 5–6 mice per group. *P < 0.05, **P < 0.01, ***P < 0.001. ND, not done.

References

    1. Pearle MS, Calhoun EA, Curhan GC. Urologic diseases in America project: urolithiasis. J Urol. 2005;173(3):848–857. doi: 10.1097/01.ju.0000152082.14384.d7. - DOI - PubMed
    1. Evan AP, et al. Renal histopathology and crystal deposits in patients with small bowel resection and calcium oxalate stone disease. Kidney Int. 2010;78(3):310–317. doi: 10.1038/ki.2010.131. - DOI - PMC - PubMed
    1. Rule AD, Krambeck AE, Lieske JC. Chronic kidney disease in kidney stone formers. Clin J Am Soc Nephrol. 2011;6(8):2069–2075. doi: 10.2215/CJN.10651110. - DOI - PMC - PubMed
    1. Hoppe B, Beck BB, Milliner DS. The primary hyperoxalurias. Kidney Int. 2009;75(12):1264–1271. doi: 10.1038/ki.2009.32. - DOI - PMC - PubMed
    1. Robijn S, Hoppe B, Vervaet BA, D’Haese PC, Verhulst A. Hyperoxaluria: a gut-kidney axis? Kidney Int. 2011;80(11):1146–1158. doi: 10.1038/ki.2011.287. - DOI - PubMed

Publication types

MeSH terms

Supplementary concepts