. 2013 Jan;123(1):380-93.
doi: 10.1172/JCI65330. Epub 2012 Dec 10.

Vertical T cell immunodominance and epitope entropy determine HIV-1 escape

Affiliations

Vertical T cell immunodominance and epitope entropy determine HIV-1 escape

Michael K P Liu et al. J Clin Invest. 2013 Jan.

Abstract

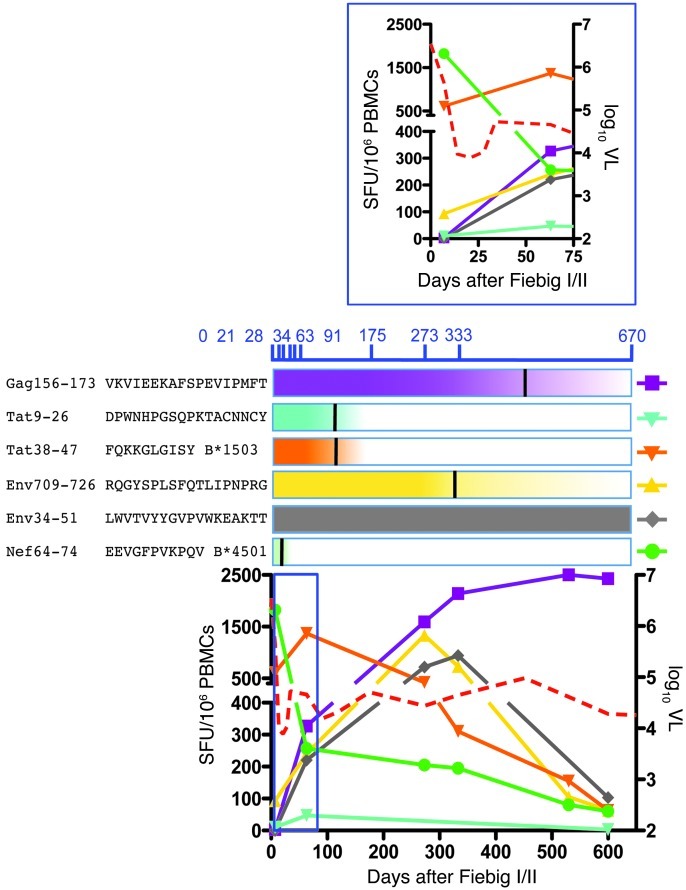
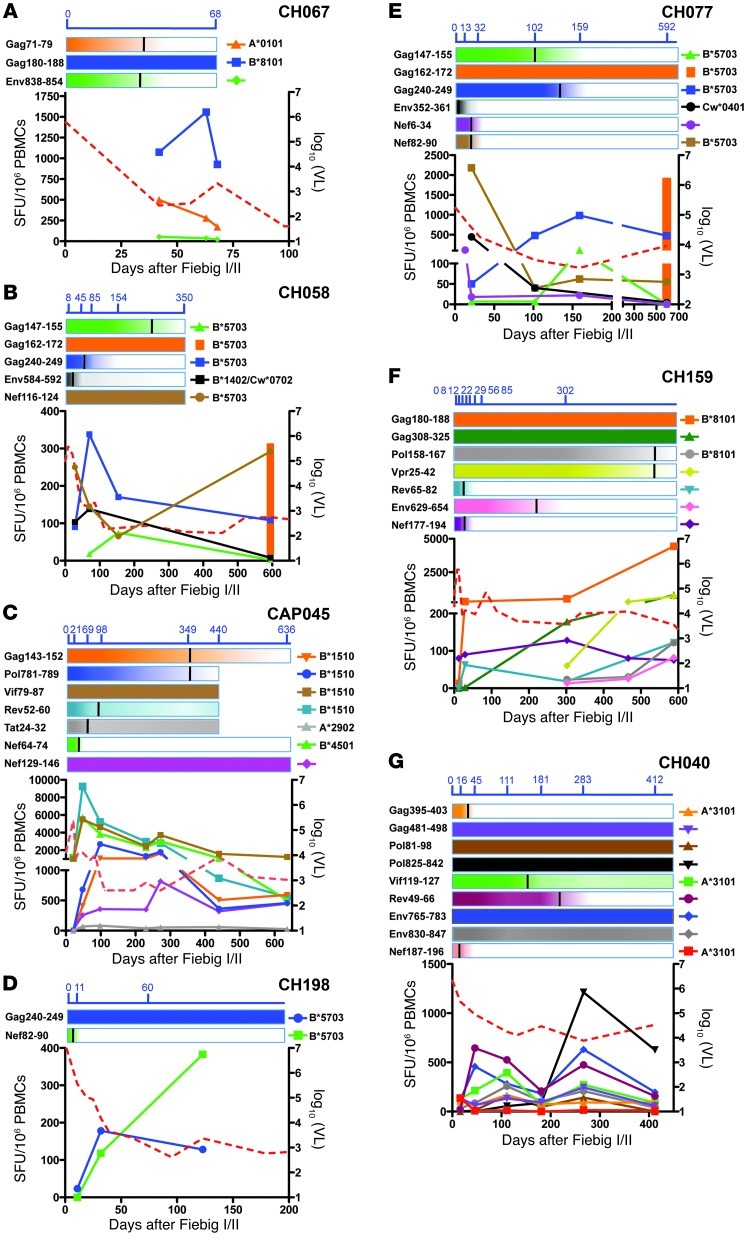
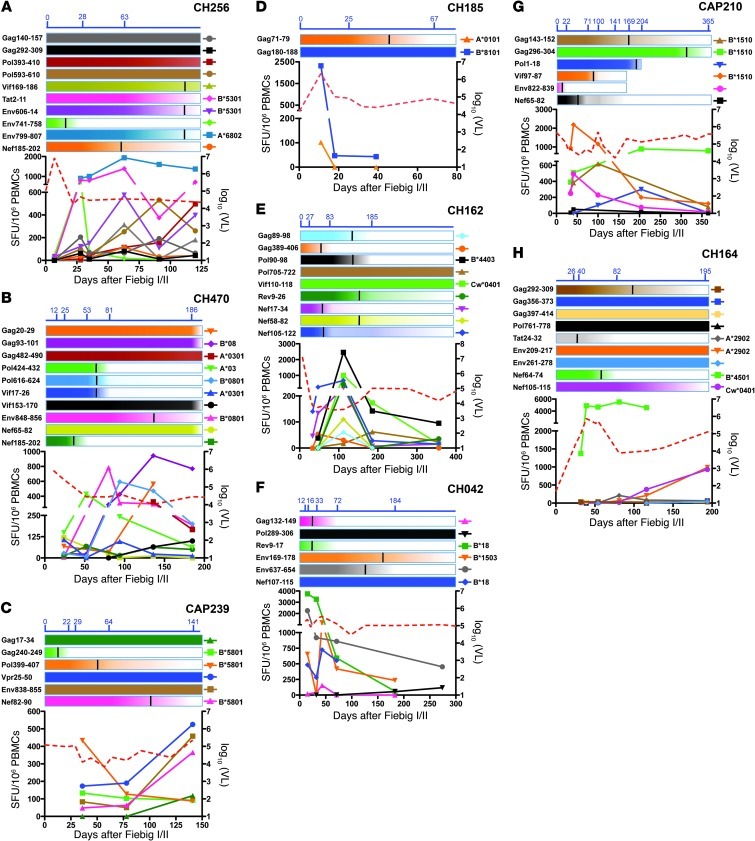
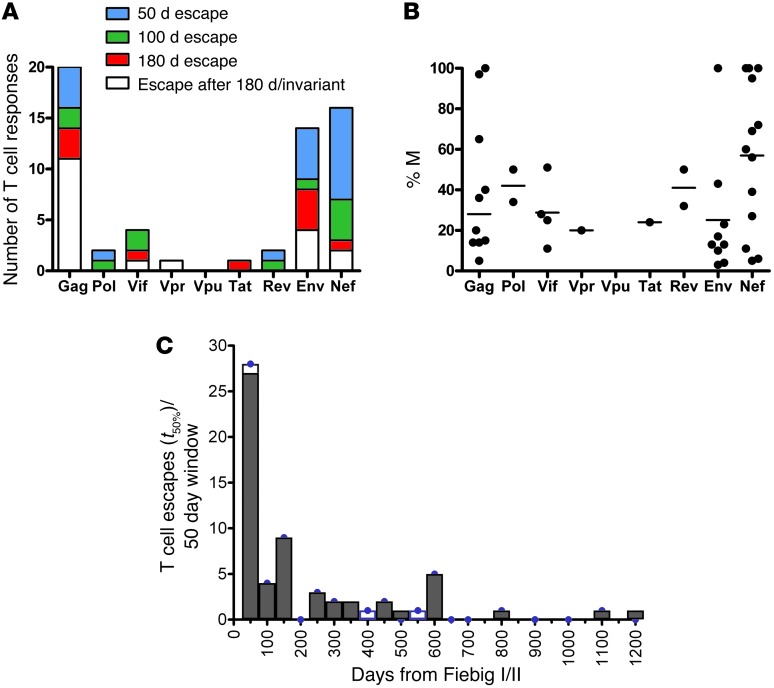
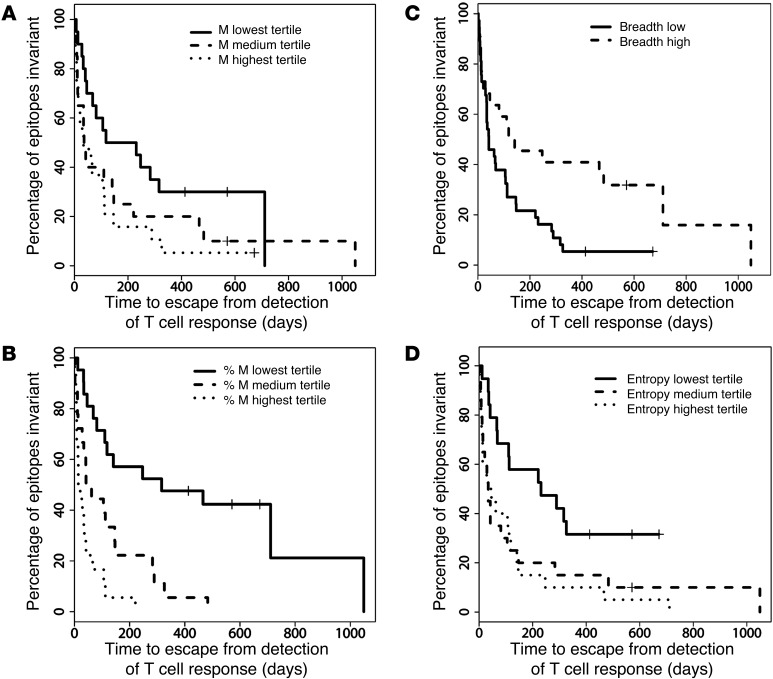
HIV-1 accumulates mutations in and around reactive epitopes to escape recognition and killing by CD8+ T cells. Measurements of HIV-1 time to escape should therefore provide information on which parameters are most important for T cell-mediated in vivo control of HIV-1. Primary HIV-1-specific T cell responses were fully mapped in 17 individuals, and the time to virus escape, which ranged from days to years, was measured for each epitope. While higher magnitude of an individual T cell response was associated with more rapid escape, the most significant T cell measure was its relative immunodominance measured in acute infection. This identified subject-level or "vertical" immunodominance as the primary determinant of in vivo CD8+ T cell pressure in HIV-1 infection. Conversely, escape was slowed significantly by lower population variability, or entropy, of the epitope targeted. Immunodominance and epitope entropy combined to explain half of all the variability in time to escape. These data explain how CD8+ T cells can exert significant and sustained HIV-1 pressure even when escape is very slow and that within an individual, the impacts of other T cell factors on HIV-1 escape should be considered in the context of immunodominance.


Figures

Figure 1
Figure 1. Shifting immunodominance of CD8+ T cell responses induced in early HIV-1 infection.
Subject CH131 was detected in acute HIV-1 infection (Fiebig stages I/II), just prior to peak viremia. HIV-1–specific CD8+ T cell responses in PBMCs were mapped using ex vivo IFN-γ ELISpot against autologous, overlapping peptides spanning the subject’s T/F virus (solid colored lines). Distinct CD8+ T cell immunodominance was observed as early as peak viremia (red dotted line). See inset for greater detail. Above the panel, the blue text indicates the days from Fiebig stages I/II when SGA sequencing was performed. Sequence at day 0 was used to deduce the T/F and subsequent sequencing used to track emerging ns mutations in the virus population. Below this text, colored bars represent the changes in the epitope sequence of the corresponding (color-matched) T cell response, with black vertical lines showing days to 50% T/F virus sequence. As the virus escapes, T cell responses often decline, after which new or subdominant T cell responses become immunodominant. The HXB2 location of each reactive peptide epitope and, if known, the HLA restriction is identified to the left of the bar. A positive T cell response required a background subtracted response of >30 SFU per million PBMCs and >4× background.
Figure 2
Figure 2. HIV-1–specific CD8 T cell kinetics.
T cell kinetics in subjects (A) CH067, (B) CH058, (C) CAP045, (D) CH198, (E) CH077, (F) CH159, and (G) CH040 with VL set points from 40–14,791 copies/ml (red dotted line). HIV-1–specific CD8+ T cell responses in PBMCs were mapped using ex vivo IFN-γ ELISpot against autologous, overlapping peptides spanning the subject’s T/F virus (solid colored lines). Above each panel, the blue text indicates the days from Fiebig stages I/II when SGA sequencing was performed. Below this text, colored bars represent the changes in the epitope sequence of the corresponding (color-matched) T cell response, with black vertical lines showing days to 50% T/F virus sequence. The HXB2 location of each reactive peptide is identified to the left of the bar, and HLA restriction (if known) is identified to the right. A positive T cell response required a background subtracted response of >30 SFU per million PBMCs and >4× background.
Figure 3
Figure 3. HIV-1–specific CD8 T cell kinetics continued.
T cell kinetics in subjects (A) CH256, (B) CH470, (C) CAP239, (D) CH185, (E) CH162, (F) CH042, (G) CAP210, and (H) CH164, with VL set points from 18,621–575,440 copies per ml (red dotted lines). HIV-1–specific CD8+ T cell responses in PBMCs were mapped using ex vivo IFN-γ ELISpot against autologous, overlapping peptides spanning the subject’s T/F virus (solid colored lines). Above each panel, the blue text indicates the days from Fiebig stages I/II when SGA sequencing was performed. Below this text, colored bars represent the changes in the epitope sequence of the corresponding (color-matched) T cell response, with black vertical lines showing days to 50% T/F virus sequence. The HXB2 location of each reactive peptide is identified to the left of the bar and HLA restriction (if known) is identified to the right. A positive T cell response required a background subtracted response of >30 SFU per million PBMCs and more than 4 times background. Subject CH607 went onto ARV approximately 5 weeks after Fiebig stages I/II. Therefore, T cell kinetics were not followed.
Figure 4
Figure 4. The first HIV-1–specific CD8+ T cells target all HIV-1 proteins but are largely immunodominant against Nef, Gag, and Envelope.
(A) The total number and the proportion of mapped T cell epitopes found in each HIV-1 protein that underwent escape in the first 50 (blue), 100 (green), and 180 (red) days from Fiebig stages I/II. (B) The magnitude of each mapped T cell response was calculated as a percentage of the total response measured in that individual. Horizontal bars represent median values; each symbol represents an individual response. (C) Histogram binning time to escape for each epitope across subjects in 50-day windows. The white blocks in columns indicate data adjusted to include putative AgP mutations (n = 3). Note that the median %M in B was higher for Nef than other proteins but was not significantly different than Gag, Vif, and Env proteins (P > 0.05, 1-way ANOVA Friedman test).
Figure 5
Figure 5. M, immunodominance (%M), breadth, and the epitope entropy of the HIV-1–specific T cell response all contribute to time to escape.
Univariate correlations of time to escape with (A) magnitude (M), (B) %M of the T cell response, and (C) T cell breadth and (D) entropy of the epitope targeted by the T cell response. T cell data are restricted to the first HIV-1–specific T cell responses detected using IFN-γ ELISpot detected within 50 days of Fiebig stages I/II. Time to virus escape was calculated from the time of first detection of the T cell response and time to 50% change in SGA sequences compared with the T/F sequence. Data were resolved into tertiles in A, B, and D and median in C. See Supplemental Table 2 for risk ratios and P values using CPH models.

References

    1. Altfeld M, et al. HLA Alleles Associated with delayed progression to AIDS contribute strongly to the initial CD8(+) T cell response against HIV-1. PLoS Med. 2006;3(10):e403. doi: 10.1371/journal.pmed.0030403. - DOI - PMC - PubMed
    1. Fellay J, et al. A whole-genome association study of major determinants for host control of HIV-1. Science. 2007;317(5840):944–947. doi: 10.1126/science.1143767. - DOI - PMC - PubMed
    1. McMichael AJ, Borrow P, Tomaras GD, Goonetilleke N, Haynes BF. The immune response during acute HIV-1 infection: clues for vaccine development. Nature reviews. Immunology. 2010;10(1):11–23. - PMC - PubMed
    1. Pereyra F, et al. The major genetic determinants of HIV-1 control affect HLA class I peptide presentation. Science. 2010;330(6010):1551–1557. doi: 10.1126/science.1195271. - DOI - PMC - PubMed
    1. Barouch DH, et al. Eventual AIDS vaccine failure in a rhesus monkey by viral escape from cytotoxic T lymphocytes. Nature. 2002;415(6869):335–339. doi: 10.1038/415335a. - DOI - PubMed

Publication types

Substances