. 2013 Feb 1;73(3):1128-41.
doi: 10.1158/0008-5472.CAN-12-2731. Epub 2012 Dec 5.

Targeting tumor-infiltrating macrophages decreases tumor-initiating cells, relieves immunosuppression, and improves chemotherapeutic responses

Affiliations

Targeting tumor-infiltrating macrophages decreases tumor-initiating cells, relieves immunosuppression, and improves chemotherapeutic responses

Jonathan B Mitchem et al. Cancer Res. .

Abstract

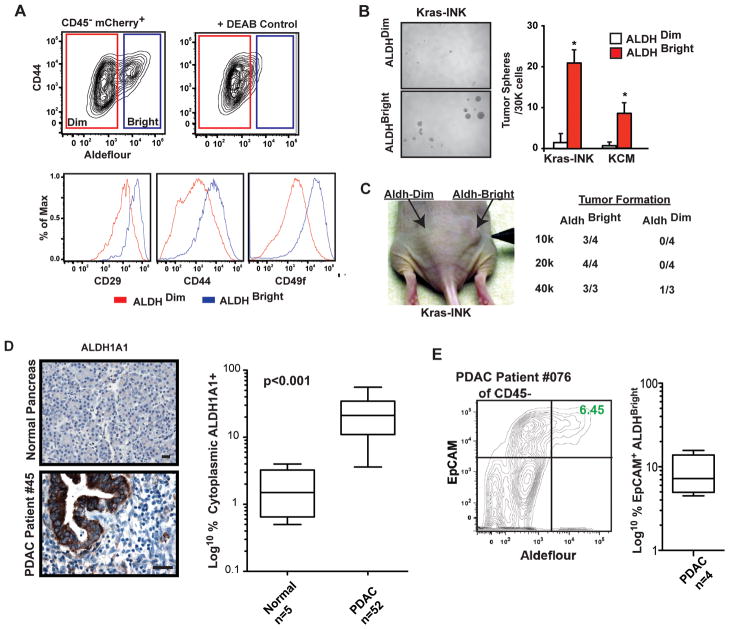
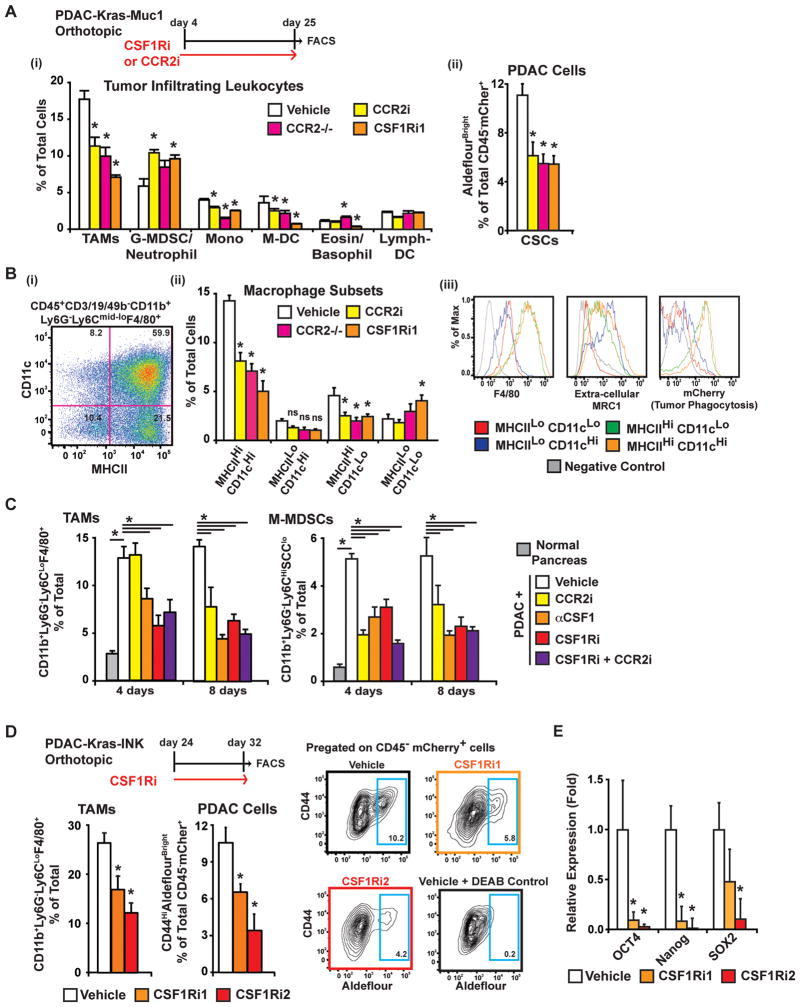
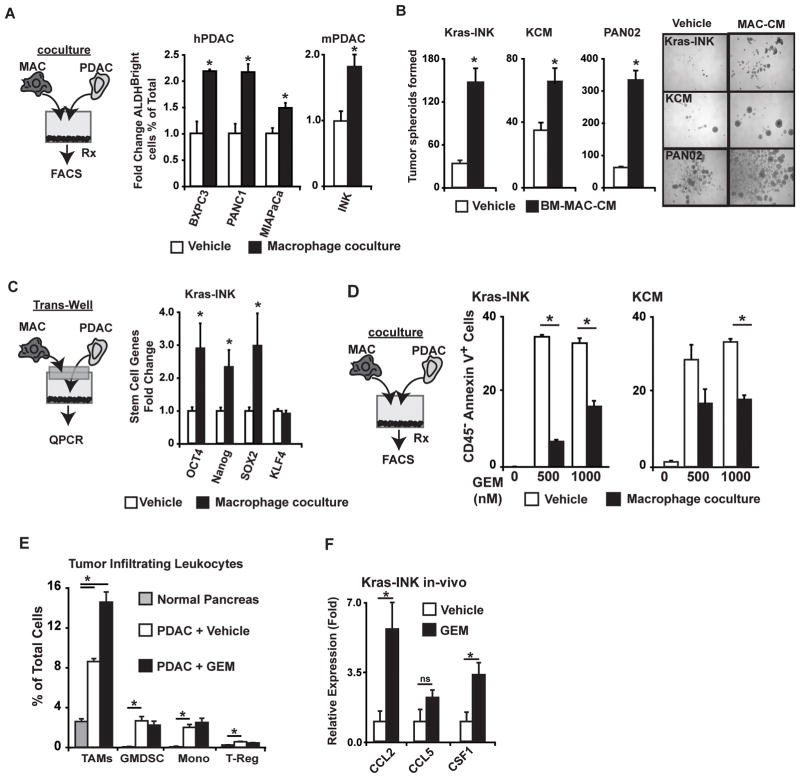
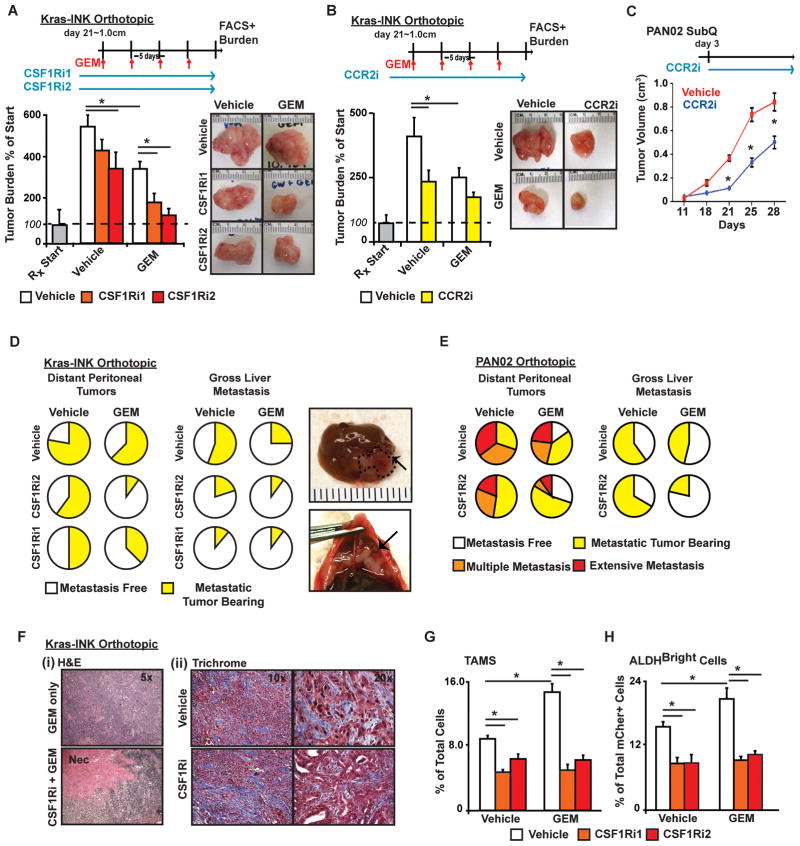
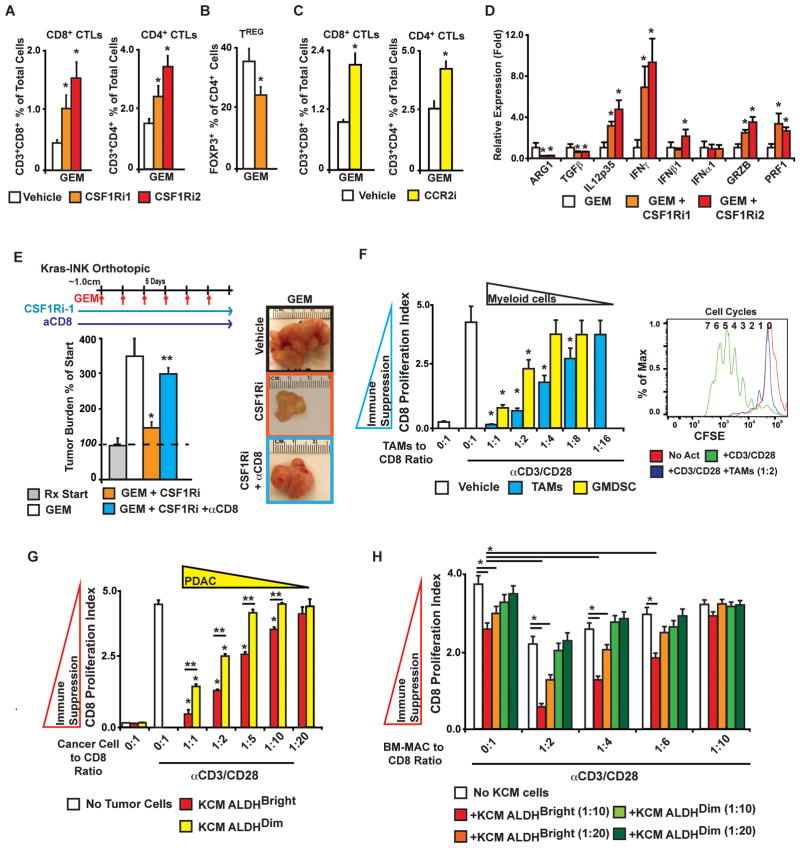
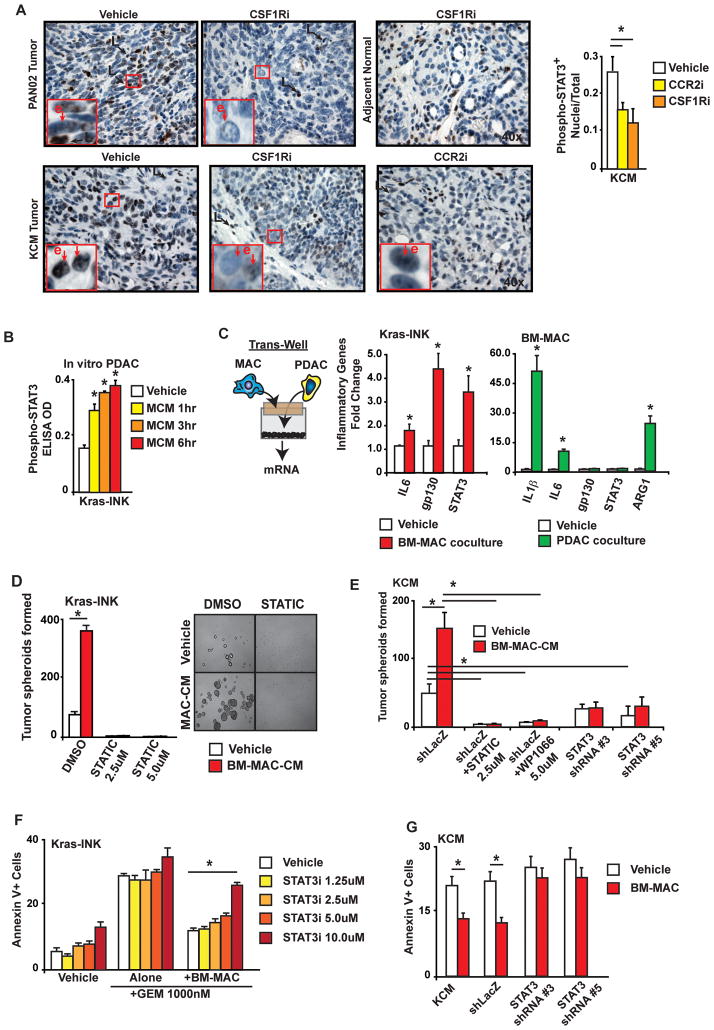
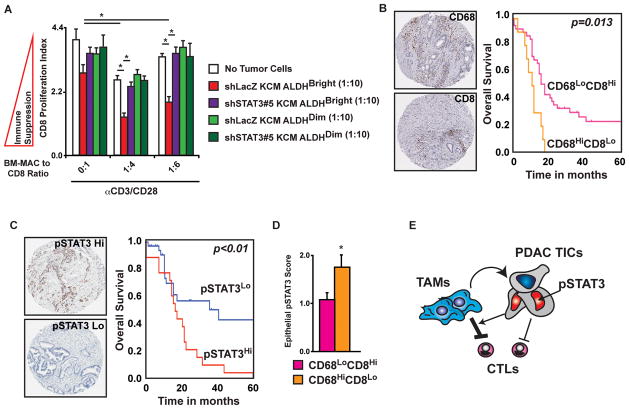
Tumor-infiltrating immune cells can promote chemoresistance and metastatic spread in aggressive tumors. Consequently, the type and quality of immune responses present in the neoplastic stroma are highly predictive of patient outcome in several cancer types. In addition to host immune responses, intrinsic tumor cell activities that mimic stem cell properties have been linked to chemoresistance, metastatic dissemination, and the induction of immune suppression. Cancer stem cells are far from a static cell population; rather, their presence seems to be controlled by highly dynamic processes that are dependent on cues from the tumor stroma. However, the impact immune responses have on tumor stem cell differentiation or expansion is not well understood. In this study, we show that targeting tumor-infiltrating macrophages (TAM) and inflammatory monocytes by inhibiting either the myeloid cell receptors colony-stimulating factor-1 receptor (CSF1R) or chemokine (C-C motif) receptor 2 (CCR2) decreases the number of tumor-initiating cells (TIC) in pancreatic tumors. Targeting CCR2 or CSF1R improves chemotherapeutic efficacy, inhibits metastasis, and increases antitumor T-cell responses. Tumor-educated macrophages also directly enhanced the tumor-initiating capacity of pancreatic tumor cells by activating the transcription factor STAT3, thereby facilitating macrophage-mediated suppression of CD8(+) T lymphocytes. Together, our findings show how targeting TAMs can effectively overcome therapeutic resistance mediated by TICs.


Conflict of interest statement

Conflict of Interest: Author David Linehan received research support from Pfizer Oncology and Novartis. Author Donal Brennan has ownership interest in his patent in for a CD8:CD68 immune signature.

Figures

Figure 1
Figure 1. ALDH1+ PDAC cells have high tumor-initiating potential
A) FACS analysis of ALDHBright cells from Kras-INK tumors. Plots of cells gated on CD45mCherry+ and stained with Aldefluor ± a DEAB inhibitor. ALDHBright (blue) and ALDHDim (red) cells are depicted. B) Analysis tumor spheroid formation from ALDHBright and ALDHDim Kras-INK and KCM cells. The mean number of tumor spheroids formed after 2 weeks is depicted. C) Paired aliquots of FACS-sorted ALDHBright and ALDHDim Kras-INK cells were injected into subcutaneous in nude mice, and tumor formation was accessed. D) Automated quantitation of cytoplasmic ALDH1A1+ cells in normal human pancreas and PDAC tissues (n=52 PDAC and 4 normal). E) Flow cytometry analysis of human PDAC tissue gated on CD45and stained for EpCAM and Aldefluor positivity. All error bars are SEM, and * denotes p<0.05 by Mann-Whitney.
Figure 2
Figure 2. Depletion of TAMs results in reduced ALDHBright TICs
A) Analysis of leukocyte and ALDHBright TIC frequency in KCM tumors from mice treated for 21 days with vehicle, CSF1Ri1, CCR2i or in CCR2−/− hosts. (i) The presence of CD11b+Ly6G Ly6CLoF4/80HiMHCII+ macrophage, CD11b+Ly6GHiLy6C+ (G-MDSC/neutrophil), CD11b+Ly6G Ly6CHiF4/80+MHCII+SSCLo monocyte (mono), CD11b+Ly6G Ly6CLoCD11cHiMHCIIHi (M-DC), CD11b+Ly6G+Ly6C MHCII+ (basophil), and CD11bLoLy6GLy6C CD11cHiMHCIIHi (Lymph-DC) subsets is depicted as the mean % of total live cells. (ii) ALDHBright TICs are depicted as the mean % of total live CD45mCherry+ cells. B) Analysis of macrophage subsets following CCR2 or CSF1R inhibition. (i) CD11b+CD3/19/49b Ly6GLy6CLoF4/80+ macrophages were subdivided by MHCII and CD11c expression, and (ii) the mean frequency of each subset is displayed for all treatment groups. (iii) Relative expression of F4/80, CD206, and mCherry (indicator of phagocytosis) is depicted. C) Flow cytometry analysis of TAMs and M-MDSCs infiltrating PAN02 tumors in mice treated for 4 or 8 days with vehicle, anti-CSF1, CCR2i, and/or CSF1Ri2 is depicted. D) The mean frequency of macrophages and CD45mCherry+ALDHBright TICs in Kras-INK tumors following 8 days of CSF1Ri treatment is depicted. Representative flow cytometry plots of mCherry+ ALDHBright tumor cells (Blue gate) are shown. E) Quantitative-RT-PCR analysis in orthotopic Kras-INK tumor tissue following treatment with CSF1Ri for 14 days. Graph depicts the mean fold change compared vehicle. Flow cytometry and quantitative-RT-PCR data depict the mean values from 5–10 mice ± SEM. * denotes statistically significant differences at p<0.05 (Mann-Whitney U-test).
Figure 3
Figure 3. Macrophages promote TIC properties in vitro
A) Analysis of ALDHBright cells frequency in human and mouse PDAC cells cocultured with human blood monocyte-derived macrophages or murine BM-MACs for 36 h. Mean fold changes in CD45ALDHBright cells is depicted. B) Quantitation of PDAC tumor spheroids following 14 days of culture in vehicle or BM-MAC conditioned medium. C) Quantitative-RT-PCR results from Kras-INK tumor cells cocultured for 24 h with BM-MACs in a Transwell chamber. Normalized mean fold changes is depicted. D) Kras-INK or KCM cells in coculture with BM-MACs were treated with GEM for 36hrs. The mean % of CD45mCherry+Annnexin V+ tumor cells is depicted (n=3). E) Analysis of immune cell infiltration following GEM treatment of mice bearing Kras-INK tumors. The mean frequency of macrophages, G-MDSC/neutrophil, monocytes (mono), and CD3+CD4+FOXP3+ TRegs is depicted (n=5 mice/group). F) Analysis of mRNA expression from Kras-INK tumor tissue from mice treated with either vehicle or GEM. Normalized mean fold change is depicted (n=5 mice/group). All graphs displayed as means ± SEM, and * denotes p<0.05 (Mann-Whitney U-test).
Figure 4
Figure 4. Inhibition of CSF1R or CCR2 overcomes chemoresistance
A–B) Mice bearing established Kras-INK tumors were treated with vehicle or CSF1Ri1, CSF1Ri2, or CCR2i (B) ± GEM. The tumor burden was accessed by wet tumor weight, and it is displayed as the mean % increase compared to five mice sacrificed at the start of treatment (“RXStart”). C) The growth of subcutaneous PAN02 tumors in mice treated with ± CCR2i is depicted (n=5/group). D–E) The frequency and/or severity of disseminated tumors in the perennial cavity or liver is depicted as the proportion of mice with gross tumors at necropsy (n=10–15 mice/group). F) (i) Images of hematoxylin and eosin staining depicts necrotic tissue (Nec) following CSF1Ri and GEM treatment, and (ii) TriChrome staining depicts collagen deposition (blue). G–H) Flow cytometry analysis of TAM and ALDHBright TIC frequency in Kras-INK tumors is depict the mean % of the total number of live cells or CD45mCherry+ cells (n=5–8 mice/group). * denotes p<0.05 (Mann-Whitney U-test or unpaired t-test) in all panels.
Figure 5
Figure 5. TAM and TIC crosstalk to suppress CTLs
A–C) Analysis of CD3+CD4+ and CD3+CD8+ T-cell (A, C) and FOXP3+ CD4+ Treg (B) infiltration into Kras-INK tumors from mice is depicted as the mean % of total live cells (n=5–6 mice/group). D) Cytokine mRNA expression assessed in Kras-INK tumors from mice treated with GEM ± CSF1Ri is depicted as mean normalized fold change compared to the GEM alone treatment group (5 animals/group). E) Mice bearing orthotopic Kras-INK tumors were treated with GEM ± CSF1Ri2 ± anti-CD8IgG. Tumor burden is depicted as the mean % increase compared to the start of treatment (“RXStart”). n=10–14 mice/group. F) CD8+ CTL suppression by tumor-infiltrating leukocytes. TAMs or G-MDSCs isolated by flow sorting were assayed for their ability to repress splenic CD8+ proliferation following anti-CD3/CD28 stimulation. The mean number of proliferation cycles is measured by CFSE dilution after 70 h of activation. A representative plot of CFSE signal intensity in CD8+ cells is depicted for un-activated, activated, and TAM cocultures (right panel). G) CD8+ CTL suppression by TICs. Isolated ALDHBright and ALDHDim KCM cells assayed for their ability to repress CD8+ proliferation following anti-CD3/CD28 stimulation. H) Suppression of CD8+ proliferation was assayed in cocultures with BM-MACs and/or isolated ALDHBright and ALDHDim KCM cells. The ratio of all cells to CD8+ CTLs is depicted. * or ** denotes p<0.05 by Mann-Whitney in all panels.
Figure 6
Figure 6. Macrophage-induced chemoresistance and stem-like properties require STAT3 signaling
A) Quantitation and ×40 images of pSTAT3+ tumor cells are depicted. The mean frequency of positive cells in PAN02 and KCM tumors treated with either vehicle or CSF1R or CCR2 inhibitors is shown (n>5/group). B) ELISA analysis of STAT3 phosphorylation in Kras-INK cells following treatment with macrophage conditioned medium (MCM). C) Normalized mean fold changes in gene expression are depicted from Kras-INK tumor cells and BM-MACs alone or in coculture for 24hrs using a Transwell chamber. D) MCM was added to adherence-free Kras-INK tumor spheroid cultures ± the STAT3 inhibitor STATIC, and the number of tumor spheroids after 14 days is depicted. E) MCM was added to adherence-free KCM-shLacZ, KCM-shSTAT3#3, or KCM-shSTAT3#5 tumor spheroid cultures ± the STAT3 inhibitors and the number of tumor spheroids after 14 days is depicted. F) Analysis of Annexin V+ Kras-INK cells in direct coculture with BM-MACs ± STATIC and treated with GEM for 36 h is depicted as % of CD45mCherry+ tumor cells (n=3/group). G) Analysis of Annexin V+ KCM, KCM-shLacZ, KCM-shSTAT3#3, or KCM-shSTAT3#5 cells cocultured with BM-MACs ± GEM is depicted (n=3/group).
Figure 7
Figure 7. Immune status and STAT3 activation predict patient survival
A) STAT3+ TICs augment macrophage-mediated immunosuppression. Suppression of CD8 proliferation was assayed in cocultures with BM-MACs and/or isolated ALDHBright and ALDHDim KCM-shLacZ or KCM-shSTAT3#5 cells. The ratio of all cells to CD8+ CTLs and the mean number of proliferation cycles is depicted. B) The CD8 to CD68 ratio predicts PDAC patient survival. Automated analysis of CD68+ and CD8+ IHC reveals the relationship between leukocyte density and overall survival. The Kaplan-Meier estimate of overall survival comparing CD68Hi/CD8Low to all other groups, denoted as CD68Low/CD8High, is shown. C) STAT3 phosphorylation predicts PDAC patient survival. The Kaplan-Meier estimate of overall survival comparing patients divided into pSTAT3Hi and pSTAT3Lo subgroups by the mean intensity score is shown. D) Mean epithelial pSTAT3 score is depicted for tumors classified as either CD68Hi/CD8Lo or CD68Hi/CD8Lo. E) Schematic depiction of the coordinated suppression of CD8+ CTLs by tumor-infiltrating macrophages and TICs. * denotes p<0.05 by Mann-Whitney, and survival p-values are log-rank (Mantel-Cox).

Similar articles

Cited by

References

    1. Grivennikov SI, Greten FR, Karin M. Immunity, inflammation, and cancer. Cell. 2010;140:883–99. - PMC - PubMed
    1. Hanahan D, Weinberg RA. Hallmarks of cancer: the next generation. Cell. 2011;144:646–74. - PubMed
    1. Koebel CM, Vermi W, Swann JB, Zerafa N, Rodig SJ, Old LJ, et al. Adaptive immunity maintains occult cancer in an equilibrium state. Nature. 2007;450:903–7. - PubMed
    1. DeNardo DG, Brennan D, Rexhapaj E, Ruffel B, Shiao S, Gallagher WM, et al. Leukocyte complexity in breast cancer predicts overall survival and functionally regulates response to chemotherapy. Cancer Discovery. 2011;1:54–67. - PMC - PubMed
    1. Pyonteck SM, Gadea BB, Wang HW, Gocheva V, Hunter KE, Tang LH, et al. Deficiency of the macrophage growth factor CSF-1 disrupts pancreatic neuroendocrine tumor development. Oncogene. 2011 - PubMed

Publication types

MeSH terms