. 2013 Feb 1;73(3):1245-55.
doi: 10.1158/0008-5472.CAN-12-3150. Epub 2012 Dec 5.

Tumor suppressor function of the plasma glutathione peroxidase gpx3 in colitis-associated carcinoma

Affiliations

Tumor suppressor function of the plasma glutathione peroxidase gpx3 in colitis-associated carcinoma

Caitlyn W Barrett et al. Cancer Res. .

Abstract

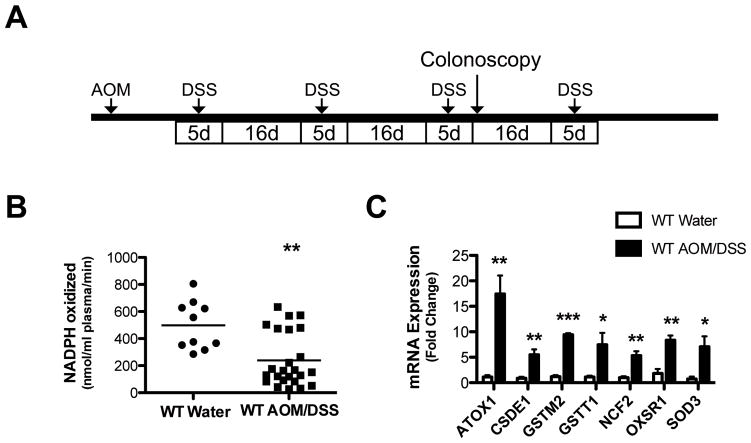
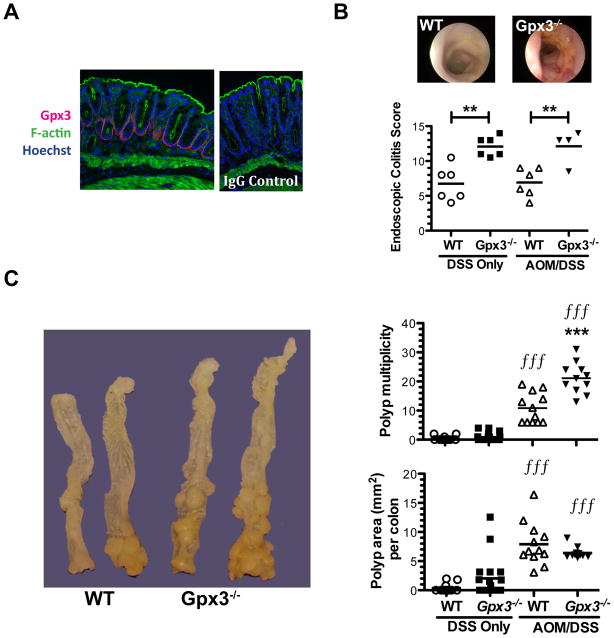
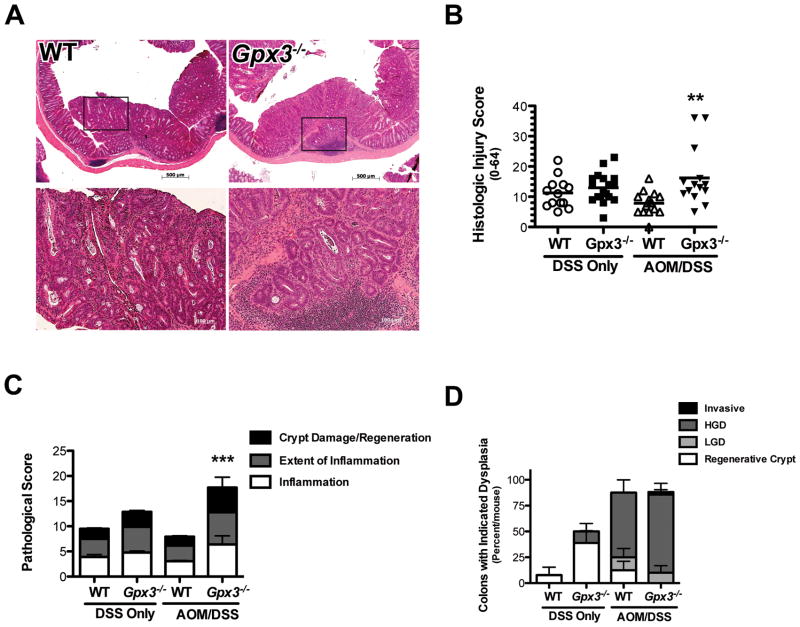
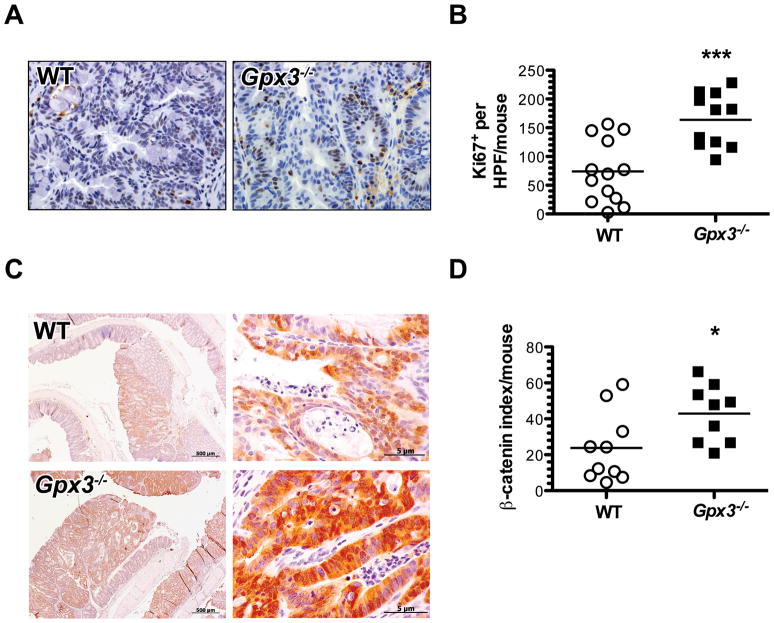
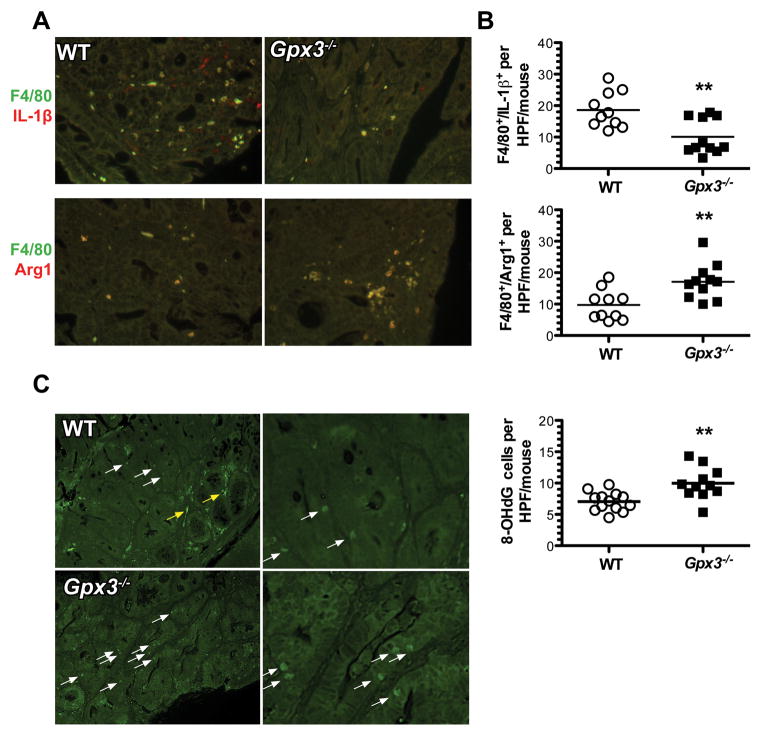
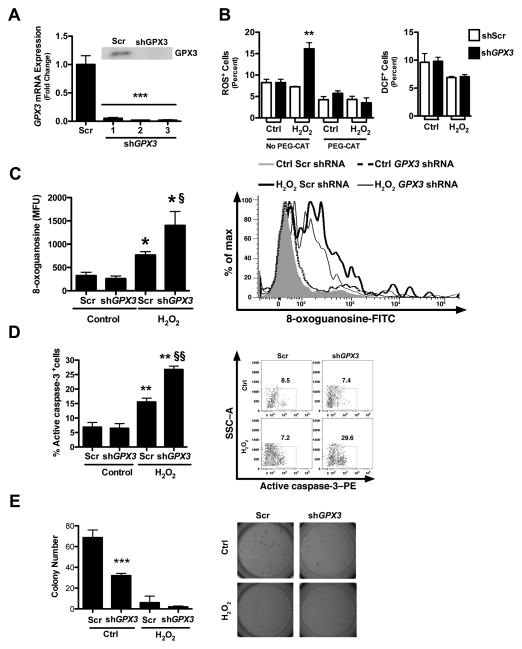
The glutathione peroxidases, a family of selenocysteine-containing redox enzymes, play pivotal roles in balancing the signaling, immunomodulatory, and deleterious effects of reactive oxygen species (ROS). The glutathione peroxidase GPX3 is the only extracellular member of this family, suggesting it may defend cells against ROS in the extracellular environment. Notably, GPX3 hypermethylation and underexpression occur commonly in prostate, gastric, cervical, thyroid, and colon cancers. We took a reverse genetics approach to investigate whether GPX3 would augment inflammatory colonic tumorigenesis, a process characterized by oxidative stress and inflammation, comparing Gpx3(-/-) mice in an established two-stage model of inflammatory colon carcinogenesis. Gpx3-deficient mice exhibited an increased tumor number, though not size, along with a higher degree of dysplasia. In addition, they exhibited increased inflammation with redistribution toward protumorigenic M2 macrophage subsets, increased proliferation, hyperactive WNT signaling, and increased DNA damage. To determine the impact of acute gene loss in an established colon cancer line, we silenced GPX3 in human Caco2 cells, resulting in increased ROS production, DNA damage and apoptosis in response to oxidative stress, combined with decreased contact-independent growth. Taken together, our results suggested an immunomodulatory role for GPX3 that limits the development of colitis-associated carcinoma.


Conflict of interest statement

There are no conflicts of interest to disclose

Figures

Figure 1
Figure 1. Plasma Gpx3 activity is decreased and oxidative stress genes are increased in mice subjected to the AOM/DSS protocol
A) Schematic of the AOM/DSS protocol. Animals injected with 12.5 mg/kg AOM at day zero followed by 4 cycles of 3% DSS ad lib separated by 16 days of recovery on water. B) Plasma glutathione peroxidase activity determined after the completion of the AOM/DSS protocol. WT water treated, N=10; WT AOM/DSS, N=11; ** P=0.0013. C) Tumor tissue mRNA expression of oxidative stress genes (ATOX1=ATX1 antioxidant protein 1 homolog; CSDE1=Cold shock domain containing E1, RNA binding; GSTM2=Glutathione S-transferase M2, muscle; GSTT1=Glutathione S-transferase theta 1; NCF2=Neutrophil cytosolic factor 2; OXSR1=Oxidative-stress responsive 1; SOD3=Superoxide dismutase 3, extracellular) in WT water treated (N=4) vs WT AOM/DSS (N=4); ***P<0.001, **P<0.01, *P<0.05.
Figure 2
Figure 2. Gpx3 functions as a tumor suppressor in inflammatory carcinogenesis
A) Immunofluorescence staining of normal WT colon. Gpx3 (red), F-actin (phalloidin, green), and Hoescht (blue) staining is shown (left). IgG control is shown on the right (60x magnification). B) Representative colonoscopic images from WT (top left) or Gpx3−/− (top right) mice after 3 cycles of DSS, and murine endoscopic colitis scoring utilizing the murine endoscopic index of colitis severity (MEICS). **P<0.01. C) Representative gross specimens from the indicated genotype (left). Tumor multiplicity (top right) and polyp burden (bottom right) are shown, results were determined via calculation of the combined surface area (Σitot SAi=Li x Wi) of all lesions in each colon. DSS only WT, N=13; Gpx3−/−, N=18, AOM/DSS WT, N=12; Gpx3−/−, N=11. *** P<0.001 between WT and Gpx3−/−. fff P<0.001 DSS only vs. AOM/DSS groups.
Figure 3
Figure 3. Increased histologic injury in Gpx3−/− colons
A) Representative H&E staining from WT (10x top, 20x bottom left) or Gpx3−/− (10x top, 20x bottom right) colons. There is evidence for invasive adenocarcinoma in the Gpx3−/− tumor. B) Histologic injury score for DSS only or AOM/DSS tissues. ** P<0.01. C) Division of the histological injury scores from Fig. 3B into pathological inflammation, extent, and crypt damage/regeneration scores for DSS only or AOM/DSS tissues. ***P<0.001. D) Dysplasia grading (performed by MKW) in WT and Gpx3−/− tumors. Results represent percentage of total tumors for each group within each grade.
Figure 4
Figure 4. Increased intratumoral proliferation and nuclear β-Catenin in Gpx3−/− tumors
α-Ki67 immunohistochemistry was performed to identify actively proliferating cells. A) Representative images of Ki67 staining in WT or Gpx3−/− tumors (40x magnification). B) Intratumoral proliferation index calculated from number of BrdU positive cells per HPF in 20 HPF/mouse. ***P=0.0003. C) β-catenin expression and localization was determined via immunohistochemistry with β-catenin as per Methods section (Gpx3−/−, N=10, WT, N=10 tumors). Representative staining for β-catenin from WT or Gpx3−/− tumors (left, 10x magnification; right, 40x magnification). D) Intratumoral β-catenin index calculated as described in the Methods section. *P=0.03.
Figure 5
Figure 5. Increased M2 macrophages and evidence for oxidative DNA damage in Gpx3−/− tumors
Immunofluorescence for M1 (IL-1β+, F4/80+) and M2 (Arg1+, F4/80+) macrophage markers and 8-OHdG was performed according to Methods. A) Example images from WT top row or Gpx3−/− tumors. B) Quantification of M1 (top) or M2 (bottom) macrophages per tumor high-powered field (HPF). **P<0.01. C) Example images from WT (top row) or Gpx3−/− (bottom row) tumors. White arrow indicates positive staining in epithelial cells, yellow arrow indicates non-specific staining. D) 8- OHdG quantification. ** P<0.01. All images taken at 40x magnification.
Figure 6
Figure 6. Increased ROS, DNA damage, and apoptosis and decreased soft agar colony formation post-GPX3 knockdown
A) GPX3 mRNA and protein (insert) expression after knockdown with GPX3-specific shRNA constructs in Caco2 cells. **P<0.01. B) Quantification of percentage of ROS positive cells (DCFH2+) post-GPX3 knockdown in untreated or 200 μM H2O2 treated Caco2 cells after pre-treatment with the H2O2 scavenger PEG-CAT (left). **P<0.01. Quantification of percentage of DCF+ (oxidation-insensitive analog) cells post-Gpx3 knockdown in untreated or H2O2 treated Caco2 cells (right). C) DNA damage as measured by 8-oxoguanosine-FITC flow cytometry in cells treated with scrambled or Gpx3-specific shRNAs and with or without H2O2 treatment. *P<0.05, fP<0.05, D) Apoptosis, assessed as staining for active caspase-3 by flow cytometry. The percent positive cells are shown. ** P<0.01, ffP<0.01. E) Colony formation assay in Matrigel in Gpx3 knockdown and scrambled control Caco2 cells with and without H2O2 treatment. ***P<0.001 Scr vs shGPX3 control.

Similar articles

Cited by

References

    1. Dincer Y, Erzin Y, Himmetoglu S, Gunes KN, Bal K, Akcay T. Oxidative DNA damage and antioxidant activity in patients with inflammatory bowel disease. Dig Dis Sci. 2007 Jul;52(7):1636–41. - PubMed
    1. Itzkowitz SH, Yio X. Inflammation and cancer IV. Colorectal cancer in inflammatory bowel disease: the role of inflammation. Am J Physiol Gastrointest Liver Physiol. 2004 Jul;287(1):G7–17. - PubMed
    1. Rachmilewitz D, Stamler JS, Bachwich D, Karmeli F, Ackerman Z, Podolsky DK. Enhanced colonic nitric oxide generation and nitric oxide synthase activity in ulcerative colitis and Crohn’s disease. Gut. 1995 May;36(5):718–23. - PMC - PubMed
    1. Ekbom A, Helmick C, Zack M, Adami HO. Ulcerative colitis and colorectal cancer. A population-based study. N Engl J Med. 1990 Nov 1;323(18):1228–33. - PubMed
    1. Irons R, Carlson BA, Hatfield DL, Davis CD. Both selenoproteins and low molecular weight selenocompounds reduce colon cancer risk in mice with genetically impaired selenoprotein expression. J Nutr. 2006 May;136(5):1311–7. - PubMed

Publication types