. 2013 Feb;109(4):1078-90.
doi: 10.1152/jn.00124.2012. Epub 2012 Dec 5.

N-geranyl cyclopropyl-carboximide modulates salty and umami taste in humans and animal models

Affiliations

N-geranyl cyclopropyl-carboximide modulates salty and umami taste in humans and animal models

Mark L Dewis et al. J Neurophysiol. 2013 Feb.

Abstract

Effects of N-geranyl cyclopropyl-carboxamide (NGCC) and four structurally related compounds (N-cyclopropyl E2,Z6-nonadienamide, N-geranyl isobutanamide, N-geranyl 2-methylbutanamide, and allyl N-geranyl carbamate) were evaluated on the chorda tympani (CT) nerve response to NaCl and monosodium glutamate (MSG) in rats and wild-type (WT) and TRPV1 knockout (KO) mice and on human salty and umami taste intensity. NGCC enhanced the rat CT response to 100 mM NaCl + 5 μM benzamil (Bz; an epithelial Na(+) channel blocker) between 1 and 2.5 μM and inhibited it above 5 μM. N-(3-methoxyphenyl)-4-chlorocinnamid (SB-366791, a TRPV1t blocker) inhibited the NaCl+Bz CT response in the absence and presence of NGCC. Unlike the WT mice, no NaCl+Bz CT response was observed in TRPV1 KO mice in the absence or presence of NGCC. NGCC enhanced human salt taste intensity of fish soup stock containing 60 mM NaCl at 5 and 10 μM and decreased it at 25 μM. Rat CT responses to NaCl+Bz and human salt sensory perception were not affected by the above four structurally related compounds. Above 10 μM, NGCC increased the CT response to MSG+Bz+SB-366791 and maximally enhanced the response between 40 and 60 μM. Increasing taste cell Ca(2+) inhibited the NGCC-induced increase but not the inosine monophosphate-induced increase in glutamate response. Addition of 45 μM NGCC to chicken broth containing 60 mM sodium enhanced the human umami taste intensity. Thus, depending upon its concentration, NGCC modulates salt taste by interacting with the putative TRPV1t-dependent salt taste receptor and umami taste by interacting with a Ca(2+)-dependent transduction pathway.


Figures
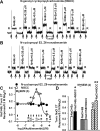
Fig. 1.
Fig. 1.
Effect of N-geranyl cyclopropylcarboximide (NGCC) and N-cyclopropyl E2,Z6-nonadienamide on the benzamil (Bz)-insensitive and Bz-sensitive NaCl chorda tympani (CT) response. A and B: representative traces of CT response obtained while the rat tongue was first stimulated with rinse solution (R) and then with NaCl (N)+Bz solutions containing 0.25 μM-50 μM NGCC (A) or N-cyclopropyl E2,Z6-nonadienamide (B) maintained at room temperature with the stimulus series 1 protocol. Arrows represent time periods when the rat tongue was superfused with R and the stimulating solutions. C: mean ± SE values of the normalized tonic CT responses from 3 animals plotted as a function of log[NGCC] concentration or log[N-cyclopropyl E2,Z6-nonadienamide] concentration expressed in moles/liter. The data with NGCC were fitted to Eq. 1. P values at 1 μM, 2.5 μM, 5 μM, and 50 μM NGCC for the mean tonic CT response were 0.0054, 0.0001, 0.0019 and 0.0002, respectively with reference to the tonic CT response at 0 NGCC. At 0.25 μM, 0.5 μM, and 10 μM NGCC the mean tonic CT responses were not significantly different (P > 0.05) from the mean CT response at 0 NGCC (paired; n = 3). D: mean normalized CT responses obtained in 4 rats while their tongues were first stimulated with R and then with N+Bz or N+ SB-366791(SB) solutions containing 0 or 2.5 μM NGCC maintained at room temperature with the stimulus series 1 protocol. Also shown are the mean normalized CT responses obtained in a separate set of 4 rats while their tongues were first stimulated with R and then with N and N+NGCC (2.5 μM). *P = 0.0107, **P = 0.0002 (unpaired; n = 4).
Fig. 2.
Fig. 2.
Effect of TRPV1/TRPV1t inhibition on the NGCC-induced changes in the Bz-insensitive NaCl CT response. A: representative CT trace obtained while the wild-type (WT) mouse tongue was first stimulated with R and then with N, N+Bz, and N+Bz+2 μM NGCC maintained at room temperature with the stimulus series 1 protocol. Arrows represent time periods when the mouse tongues were superfused with R and the stimulating solutions. B: representative CT trace obtained while the WT mouse tongue was first stimulated with R and then with N+Bz+SB solutions containing NGCC (0.25–50 μM) maintained at room temperature with the stimulus series 2 protocol. C: representative CT trace in a TRPV1 knockout (KO) mouse while the mouse tongue was first stimulated with R and then with N, N+Bz, and N+Bz+2 μM NGCC maintained at room temperature with the stimulus series 1 protocol. Arrows represent time periods when the mouse tongues were superfused with R and the stimulating solutions. D: summary of the normalized CT responses to N+Bz, N+Bz+SB, and N+Bz+SB+2 μM NGCC in 3 WT mice and N+Bz and N+Bz+2 μM NGCC in 3 TRPV1 KO mice.
Fig. 3.
Fig. 3.
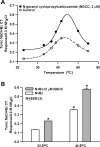
Modulatory effect of elevated temperature on the Bz-insensitive NaCl CT response in the absence and presence of NGCC. A: rat tongue was first stimulated with R and then with N+Bz solutions containing 0 (control) or 2 μM NGCC maintained at 23°C, 33°C, 36.8°C, 39°C, 41.7°C, 50°C, and 55°C with the stimulus series 3 protocol. The normalized CT response data at the various temperatures shown were fitted to Eq. 4. Tonic responses to increasing temperature were compared in the absence and presence of 2 μM NGCC. Significant differences were found for increasing temperature (P = 0.01 for both, 2-way ANOVA; Bonferroni corrected) and their interactions (P = 0.001). B: mean normalized CT response in 3 rats to N+Bz and N+Bz+2 μM NGCC at 22.5°C and 42.5°C. *P = 0.0001 with respect to CT response to N+Bz at 22.5°C (unpaired).
Fig. 4.
Fig. 4.
CT responses to monosodium glutamate (MSG), MSG+ inosine 5′-monophosphate (IMP), MSG+NGCC, and MSG+IMP+NGCC. A: representative CT trace in which the rat tongue was first stimulated with R and then with MSG+Bz+SB, MSG+Bz+SB+IMP (1 mM), and MSG+Bz+SB+NGCC (2.5–100 μM) maintained at room temperature with the stimulus series 4 protocol. Arrows show time period when the tongue was superfused with R and stimulating solutions. B: normalized mean ± SE tonic CT response from 3 animals for MSG+SB+Bz, MSG+SB+Bz+1 mM IMP, MSG+SB+Bz+100 μM NGCC, and MSG+SB+Bz+1 mM IMP+100 μM NGCC. *P values for mean MSG+Bz+SB CT response in the presence of 1 mM IMP, 100 μM NGCC, and 1 mM IMP+100 μM NGCC were 0.0226, 0.0085, and 0.0065, respectively, relative to MSG+Bz+SB (paired; n = 3).
Fig. 5.
Fig. 5.
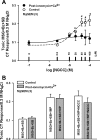
Effect of ionomycin+Ca2+ on the CT response to MSG, MSG+NGCC, MSG+IMP, and MSG+IMP+NGCC. A: relationship between the normalized mean ± SE tonic CT response to MSG+Bz+SB in 3 rats as a function of the log [NGCC] concentration between 0.25 and 100 μM (expressed as mol/l) under control conditions (Control). The CT data with varying NGCC concentration were fitted to Eq. 5. *P values for mean MSG+Bz+SB CT response in the presence of 20, 40, 60, and 100 μM NGCC were 0.0002, 0.0054, 0.0037, and 0.0085, respectively, relative to MSG+Bz+SB alone. Relationship between normalized mean ± SE tonic CT response to MSG+Bz+SB+10 mM Ca2+ in same 3 rats as a function of log [NGCC] concentration between 0.25 and 100 μM (in mol/l) after topical lingual application of 150 μM ionomycin for 30 min with the stimulus series 4 protocol is also shown (Post-ionomycin+Ca2+). The CT data with varying NGCC concentration were fitted to Eq. 5. P values at all NGCC concentrations were not significantly different (P > 0.05; paired; n = 3) relative to control. B: normalized mean ± SE tonic CT response from 3 animals for MSG+Bz+SB, MSG+Bz+SB+1 mM IMP, and MSG+Bz+SB+1 mM IMP+100 μM NGCC under control conditions and after topical lingual application of 150 μM ionomycin for 30 min with the stimulus series 4 protocol.
Fig. 6.
Fig. 6.
Effect of NGCC on the CT responses in rinse solution. A: representative CT trace obtained while the rat tongue was stimulated with R and then with MSG+Bz+SB solutions containing 60 μM or 100 μM NGCC maintained at room temperature. Arrows show time period when the tongue was superfused with R, R+NGCC, MSG+Bz+SB, or MSG+Bz+SB+NGCC. B: mean normalized tonic CT responses to 300 mM NaCl, 100 mM KCl, 100 mM CaCl2, 500 mM sucrose, 20 mM quinine, and 20 mM HCl in the absence and presence of 2.5 and 50 μM NGCC in 3 rats. *P = 0.0184, **P = 0.0002 (unpaired; n = 3).
Fig. 7.
Fig. 7.
Effect of NGCC on human salt taste perception. A: NGCC solutions containing 2.5, 5, 10, and 25 μM NGCC were prepared in H2O or 80 mM NaCl and compared with reference solutions with a 15-point intensity scale. NaCl solutions containing 8.7, 14.4, 25.8, 60, 80, and 100 mM NaCl were assigned scores of 0.5, 1.0, 2.0, 5.0, 6.8, and 8.5, respectively. Values are means ± SE of relative salt taste intensity from 10–18 trained panelists at the Korea Food Research Institute (KFRI). The data were analyzed by 1-way ANOVA followed by Duncan's multiple-range test to evaluate between-group differences. *P < 0.05. B: effect of NGCC on salty taste was assessed with a 15-point intensity scale in a commercial fish soup stock in which the final concentration of Na+ was adjusted to 60 mM. The stock without NGCC was presented as a control and the stock plus 2.5, 5, 10, and 25 μM NGCC as test samples. Values are presented as means ± SE of relative salt taste intensity from 10–18 trained panelists at KFRI. The data were analyzed by 1-way ANOVA followed by Duncan's multiple-range test to evaluate between-group differences. *P < 0.05. C: effect of NGCC on umami taste was evaluated with a 16-point intensity scale in a retorted International Flavors & Fragrances (IFF) low-sodium chicken broth (control, 60 mM Na+) and control with added 6 mM MSG or 45 μM NGCC. Values are presented as means ± SE of relative umami taste intensity from 9 trained panelists at IFF. *P < 0.05.
None

Similar articles

Cited by

References

    1. Chaudhari N, Yang H, Lamp C, Delay E, Cartford C, Than T, Roper S. The taste of monosodium glutamate: membrane receptors in taste buds. J Neurosci 16: 3817–3826, 1996 - PMC - PubMed
    1. Chaudhari N, Landin AM, Roper SD. A metabotropic glutamate receptor variant functions as a taste receptor. Nat Neurosci 3: 113–119, 2000 - PubMed
    1. Coleman J, Williams A, Phan TH, Mummalaneni S, Melone P, Ren ZJ, Zhou H, Mahavadi S, Murthy KS, Katsumata T, DeSimone JA, Lyall V. Strain differences in the neural, behavioral, and molecular correlates of sweet and salty taste in naive, ethanol- and sucrose-exposed P and NP rats. J Neurophysiol 106: 2606–2621, 2011 - PMC - PubMed
    1. Damak S, Rong M, Yasumatsu K, Kokrashvili Z, Pérez CA, Shigemura N, Yoshida R, Mosinger B, Jr, Glendinning JI, Ninomiya Y, Margolskee RF. Trpm5 null mice respond to bitter, sweet, and umami compounds. Chem Senses 31: 253–264, 2006 - PubMed
    1. Davis JB, Smart D, Gunthorpe MJ. The vanilloid receptor and vanilloid receptor-like genes: a hot topic getting hotter. Celltransmissions 18: 3–9, 2002

Publication types

MeSH terms

LinkOut - more resources