. 2013 Jan;41(2):1223-40.
doi: 10.1093/nar/gks1130. Epub 2012 Dec 5.

Human mitochondrial RNA decay mediated by PNPase-hSuv3 complex takes place in distinct foci

Affiliations

Human mitochondrial RNA decay mediated by PNPase-hSuv3 complex takes place in distinct foci

Lukasz S Borowski et al. Nucleic Acids Res. 2013 Jan.

Abstract

RNA decay is usually mediated by protein complexes and can occur in specific foci such as P-bodies in the cytoplasm of eukaryotes. In human mitochondria nothing is known about the spatial organization of the RNA decay machinery, and the ribonuclease responsible for RNA degradation has not been identified. We demonstrate that silencing of human polynucleotide phosphorylase (PNPase) causes accumulation of RNA decay intermediates and increases the half-life of mitochondrial transcripts. A combination of fluorescence lifetime imaging microscopy with Förster resonance energy transfer and bimolecular fluorescence complementation (BiFC) experiments prove that PNPase and hSuv3 helicase (Suv3, hSuv3p and SUPV3L1) form the RNA-degrading complex in vivo in human mitochondria. This complex, referred to as the degradosome, is formed only in specific foci (named D-foci), which co-localize with mitochondrial RNA and nucleoids. Notably, interaction between PNPase and hSuv3 is essential for efficient mitochondrial RNA degradation. This provides indirect evidence that degradosome-dependent mitochondrial RNA decay takes place in foci.


Figures

Figure 1.
Figure 1.
PNPase depletion stabilizes mitochondrial transcripts. (A) Schematic representation of the RNA half-life measurement, details in the text. (B) Graph representing quantified RNA half-lives of the mitochondrial transcripts. The mean values obtained in 10 independent experiments are presented. Error bars represent standard deviation. The P-values were obtained in an ANOVA test. Quantification of the half-life of mirror COX1 in cells transfected with control siRNA or rescued by expression of exogenous PNPase was impossible because of its low abundance.
Figure 2.
Figure 2.
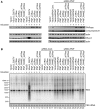
Silencing of PNPase leads to accumulation of mtRNA degradation intermediates. Stable cell lines (PNP_si1Res, PNP_si2Res) that express inducible PNPase resistant to siRNA anti-PNPase or control cell line having integrated empty vector was transfected with two different siRNAs specific for PNPase (si1 and si2) or control siRNA. Expression of exogenous PNPase was induced by tetracycline at the transfection point. Cells were collected 4 days post-transfection and analyzed by western and northern techniques. (A) Western blot analysis of the PNPase and hSuv3 levels, as standardization actin staining was performed. (B) Schematic representation of the polycistronic RNA resulting from H- or L-strand transcription and localization of the used riboprobes. (C) Northern blot analysis using strand-specific riboprobes. Some hybridization signal was unspecific (especially from cytoplasmic rRNA). This was controlled using RNA isolated from 143B rho0 (devoid of mtDNA) and their parental 143B cells. Cytosolic 18S rRNA staining by methylene blue is shown as a loading control.
Figure 3.
Figure 3.
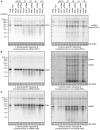
PNPase depletion affects mitochondrial mRNAs. Stable cell lines (PNP_si1Res, PNP_si2Res) that express inducible PNPase resistant to siRNA anti-PNPase or control cell line having integrated empty vector was transfected with two different siRNAs specific for PNPase (si1 and si2) or control siRNA. Expression of exogenous PNPase was induced by tetracycline at the transfection point. Cells were collected 4 days post-transfection and subjected to RNA isolation and northern blot analysis. Strand-specific riboprobes were used to detect mRNAs for COX1, COX2 and CytB (A, B, and C respectively, left panels) or their antisense counterparts (A, B, and C, right panels). Some hybridization signal was unspecific (especially from cytoplasmic rRNA). This was controlled using RNA isolated from 143B rho0 (devoid of mtDNA) and 143B cells (parent of 143B rho0). Cytosolic 18S rRNA staining by methylene blue is shown as a loading control.
Figure 4.
Figure 4.
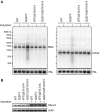
Active PNPase is necessary for mitochondrial RNA degradation. Using two different siRNAs (si1 and si2), endogenous PNPase was depleted in stable cell lines that express inducible catalytic active PNPase resistant to siRNA (PNP_si1Res and PNP_si2Res) or its inactive counterpart (PNP_R446E_si1Res and PNP_R446E_si2Res). As a control, a stable cell line with integrated empty vector was used, and also, transfection with control siRNA was performed. The 293 cell line expressing catalytically inactive hSuv3 (hSuv3_G207V) was used for a comparison with an effect of PNPase dysfunction. Expression of inactive PNPase leads to a weak dominant-negative effect. (A) Western blot analysis of the PNPase and hSuv3 levels. For standardization, actin staining was performed. (B) Northern blot analysis of ND2 transcript, probe detecting RNA transcribed from both H- and L-strand of mtDNA, was used. Cytosolic 18S rRNA staining by methylene blue is shown as a loading control.
Figure 5.
Figure 5.
Deletion of residue 510–514 of hSuv3 disables PNPase–hSuv3 complex formation. Analysis of RNA isolated from stable 293 cell lines expressing, in an inducible manner, different forms of hSuv3 (WT: wild type, G207V: catalytically inactive, WT/Δ510-514: wild type with deletion of 510–514 residues and G207V/Δ510-514: catalytically inactive with deletion of 510-514 residues). Expression of exogenous hSuv3 by tetracycline is indicated. Cells were collected 3 days after induction and analyzed by northern and western blotting. (A) Northern blot analysis of ND2 and COX2 transcripts, probes detecting RNA transcribed from both H- and L-strand of mtDNA, were used. The level of 7SL is shown as a loading control. (B) Western blot analysis of the hSuv3 level. Actin staining was performed for standardization.
Figure 6.
Figure 6.
Co-purification of PNPase and hSuv3 helicase is not an artifact. (A) Schematic representation of the experiment. Mitochondria from 293 cells expressing hSuv3 or PNPase in fusion with the TAP or FLAG tag, respectively, were isolated, mixed together, lysed and chromatographic purification of hSuv3-TAP was performed. (B, C) Western blot analysis of the endogenous and exogenous PNPase levels in mitochondrial extracts and purified fractions obtained during hSuv3-TAP purification. Specific anti-PNPase or anti-FLAG tag antibodies were used. (C) The presence of RNase A during purification is indicated. The TAP-tagged hSuv3 protein is also detected because applied secondary antibodies produced in rabbit (B, left panel and C) or primary antibodies produced in mouse (B, right panel) bind directly to the protein A, which is a component of TAP tag.
Figure 7.
Figure 7.
PNPase and hSuv3 helicase interact in vivo. (A) FLIM-FRET analysis of PNPase expressed in fusion with EGFP and hSuv3 expressed in fusion with mCherry. Images are color coded with respect to the average fluorescence lifetime of PNPase-EGFP. Fluorescence lifetime histograms obtained by time-correlated single photon counting generated for defined regions of the cells are presented. Calculated lifetimes and amplitudes are presented in the table. (B) BiFC analysis of hSuv3 and PNPase expressed in fusion with N- and C-terminal part of Venus, respectively. Mitochondria were visualized with MitoTracker Orange. The 3D reconstructions of fluorescence images are presented. The surface of mitochondria was made transparent to visualize PNPase–hSuv3 foci (A, B). Imaging of the living cells was performed. Bars represent 10 µm.
Figure 8.
Figure 8.
The PNPase–hSuv3 complex is formed in foci and co-localizes with mtRNA and mtDNA. (A) The complex of PNPase and hSuv3 was visualized using the BiFC technique by expression of PNPase-C-Venus and hSuv3-N-Venus fusion proteins in HeLa cells. PNPase-C-Venus was stained using specific antibodies anti-GFP. The 3D reconstruction of fluorescence image is presented. The surface of mitochondria was made transparent to visualize PNPase–hSuv3 foci. (B) The 3D reconstruction of PNPase–hSuv3 complexes, which were visualized by the BiFC technique, co-localizing with mtRNA and mtDNA. RNA was stained by BrU labeling and appropriate antibodies; DNA was stained using anti-DNA antibodies. The cross-section of the zoomed image is shown, which allows looking inside the objects. (C) Images resulting from object-based co-localization studies performed on the image presented in B. Only co-localizing spots are shown. The threshold for co-localization was 0.25 µm, the distance between centers of the objects. (A–C) Bars represent 10 µm. (D) Graph representing the mean values of co-localization of the wild-type and inactive (R446E/G207V) PNPase–hSuv3 complex with mtRNA or mtDNA, or both. Co-localization of mitochondrial nucleoids with mtRNA is also shown. The P values obtained in a t-test were <0.0001 (***) or not significant (NS). The standard deviations are shown. (E) Graph representing the total numbers of BiFC, mtRNA and mtDNA spots in cells transfected with plasmids encoding wild-type or inactive forms of PNPase (R446E) and hSuv3 (G207V). The mean values and standard deviations are shown. The differences are statistically insignificant.
Figure 9.
Figure 9.
PNPase depletion impairs cell growth, mitochondrial ATP concentration and the level of COX2 protein. (A) The inhibition of cell growth on PNPase silencing. 293 T-Rex cells were transfected with siRNA specific for PNPase or negative control siRNA. Cells were counted every 2 days since transfection. Bars represent mean values obtained in three independent experiments; error bars represent standard deviation. (B) Western blot analysis of OXPHOS subunits, as standardization actin staining was performed. Stable cell lines (PNP_si1Res, PNP_si2Res) that express inducible PNPase resistant to siRNA anti-PNPase or control cell line having integrated empty vector was transfected with two different siRNAs specific for PNPase (si1 and si2) or control siRNA. (C) Quantification of ATP levels in mitochondria after depletion of PNPase. Stable cell line that expresses inducible PNPase resistant to siRNA anti-PNPase and control cell line having integrated empty vector were transfected with siRNA specific for PNPase (si1) or control siRNA. Mitochondria were isolated and ATP levels were analyzed with luminometric assay. As a control, stable cell lines expressing hSuv3 or its catalytically inactive mutant hSuv3_G207V was used. Mean values of three independent experiments are shown; error bars represent standard deviations. (D) Quantification of ATP levels in 293 T-Rex cells treated with inhibitors of ATP synthesis. In all cases, culture media were supplemented with 2-deoxy-D-glucose (inhibitor of glycolysis). Cells were treated with atractyloside (blocks ATP-ADP translocase) or two indicated concentrations of sodium azide (inhibits cytochrome oxidase). Cells were collected after 2, 6, 12 and 24 h, and ATP concentrations were analyzed by luminometric assay. Mean values from three independent measurements are presented; error bars represent standard deviations. (E) Northern blot analysis of RNA isolated from cells described in C. Strand-specific riboprobes were used. Cytosolic 18S rRNA staining by methylene blue is shown as a loading control.

References

    1. Carpousis AJ. The RNA degradosome of Escherichia coli: an mRNA-degrading machine assembled on RNase E. Annu. Rev. Microbiol. 2007;61:71–87. - PubMed
    1. Dziembowski A, Piwowarski J, Hoser R, Minczuk M, Dmochowska A, Siep M, van der Spek H, Grivell L, Stepien PP. The yeast mitochondrial degradosome. Its composition, interplay between RNA helicase and RNase activities and the role in mitochondrial RNA metabolism. J. Biol. Chem. 2003;278:1603–1611. - PubMed
    1. Lykke-Andersen S, Tomecki R, Jensen TH, Dziembowski A. The eukaryotic RNA exosome: same scaffold but variable catalytic subunits. RNA Biol. 2011;8:61–66. - PubMed
    1. Chlebowski A, Tomecki R, Lopez ME, Seraphin B, Dziembowski A. Catalytic properties of the eukaryotic exosome. Adv. Exp. Med. Biol. 2011;702:63–78. - PubMed
    1. Parker R, Sheth U. P bodies and the control of mRNA translation and degradation. Mol. Cell. 2007;25:635–646. - PubMed

Publication types

MeSH terms