Meta-Analysis
. 2013 Jan;24(1):110-21.
doi: 10.1097/EDE.0b013e318276cad7.

Heterosexual HIV-1 infectiousness and antiretroviral use: systematic review of prospective studies of discordant couples

Affiliations
Meta-Analysis

Heterosexual HIV-1 infectiousness and antiretroviral use: systematic review of prospective studies of discordant couples

Rebecca F Baggaley et al. Epidemiology. 2013 Jan.

Abstract

Background: Recent studies have estimated the reduction in HIV-1 infectiousness with antiretroviral therapy (ART), but high-quality studies such as randomized controlled trials, accompanied by rigorous adherence counseling, are likely to overestimate the effectiveness of treatment-as-prevention in real-life settings.

Methods: We attempted to summarize the effect of ART on HIV transmission by undertaking a systematic review and meta-analysis of HIV-1 infectiousness per heterosexual partnership (incidence rate and cumulative incidence over study follow-up) estimated from prospective studies of discordant couples. We used random-effects Poisson regression models to obtain summary estimates. When possible, the analyses were further stratified by direction of transmission (man-to-woman or woman-to-man) and economic setting (high- or low-income countries). Potential causes of heterogeneity of estimates were explored through subgroup analyses.

Results: Fifty publications were included. Nine allowed comparison between ART and non-ART users within studies (ART-stratified studies), in which summary incidence rates were 3.6/100 person-years (95% confidence interval = 2.0-6.5) and 0.2/100 person-years (0.07-0.7) for non-ART- and ART-using couples, respectively (P < 0.001), constituting a 91% (79-96%) reduction in per-partner HIV-1 incidence rate with ART use. The 41 studies that did not stratify by ART use provided estimates with high levels of heterogeneity (I statistic) and few reported levels of ART use, making interpretation difficult. Nevertheless, estimates tended to be lower with ART use. Infectiousness tended to be higher for low-income than high-income settings, but there was no clear pattern by direction of transmission (man-to-woman and woman-to-man).

Conclusions: ART substantially reduces HIV-1 infectiousness within discordant couples, based on observational studies, and could play a major part in HIV-1 prevention efforts. However, the non-zero risk from partners receiving ART demonstrates that appropriate counseling and other risk-reduction strategies for discordant couples are still required. Additional estimates of ART effectiveness by adherence level from real-life settings will be important, especially for persons starting treatment early without symptoms.


Figures

Figure 1
Figure 1
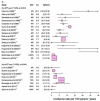
Forest plot summary of HIV-1 incidence rate estimates per heterosexual partnership for ART-stratified studies, with 95% confidence intervals. The first row for each study denotes couples where the index was receiving ART (forest plot boxes in blue); the second row denotes couples with no ART received (forest plot boxes in red). Size of boxes is proportional to number of couples, except for Watera et al 2009 (19) and Sullivan et al 2009 (20, 21) which do not provide these data. Baeten* et al (67) refers to ART for the initially uninfected partner rather than the index (pre-exposure prophylaxis) and is shown in the figure but has not been included in the summary estimates. Inc indicates per partnership HIV-1 incidence rate per 100 person-years; n, number of HIV-1 discordant couples; NR, not recorded in publication; x, number of HIV-1 transmitting couples.
Figure 2
Figure 2
Forest plot summary of HIV-1 incidence rate estimates per heterosexual partnership, with 95% confidence intervals, for non-ART-stratified studies from high-income settings, by direction of transmission: A. combined male-to-female and female-to-male transmission; B. male-to-female transmission; and C. female-to-male transmission. Estimates are classified as no ART use (up to 3% antiretroviral use by study participants – see Methods for classification criteria) and any ART use. Within these two groups, study estimates are plotted in order of increasing ART use and then chronologically. Size of boxes is proportional to number of couples. ART indicates reported percentage ART usage among index cases; Inc, per partnership HIV-1 incidence rate per 100 person-years; NR, not recorded in publication.
Figure 2
Figure 2
Forest plot summary of HIV-1 incidence rate estimates per heterosexual partnership, with 95% confidence intervals, for non-ART-stratified studies from high-income settings, by direction of transmission: A. combined male-to-female and female-to-male transmission; B. male-to-female transmission; and C. female-to-male transmission. Estimates are classified as no ART use (up to 3% antiretroviral use by study participants – see Methods for classification criteria) and any ART use. Within these two groups, study estimates are plotted in order of increasing ART use and then chronologically. Size of boxes is proportional to number of couples. ART indicates reported percentage ART usage among index cases; Inc, per partnership HIV-1 incidence rate per 100 person-years; NR, not recorded in publication.
Figure 3
Figure 3
Forest plot summary of HIV-1 incidence rate estimates per heterosexual partnership, with 95% confidence intervals, for non-ART-stratified studies from low-income settings, by direction of transmission: A. combined male-to-female and female-to-male transmission; B. male-to-female transmission; and C. female-to-male transmission. Estimates are classified as no ART use (up to 3% antiretroviral use by study participants – see Methods for classification criteria) and any ART use. Within these two groups, study estimates are plotted in order of increasing ART use and then chronologically. Size of boxes is proportional to number of couples. Hugonnet et al 2002 (34) provides two per partnership estimates: one risk for partners of infected individuals at baseline and one risk for partners of individuals who seroconverted during follow-up. ART indicates reported percentage ART usage among index cases; Inc, per partnership HIV-1 incidence rate per 100 person-years; NR, not recorded in publication.
Figure 3
Figure 3
Forest plot summary of HIV-1 incidence rate estimates per heterosexual partnership, with 95% confidence intervals, for non-ART-stratified studies from low-income settings, by direction of transmission: A. combined male-to-female and female-to-male transmission; B. male-to-female transmission; and C. female-to-male transmission. Estimates are classified as no ART use (up to 3% antiretroviral use by study participants – see Methods for classification criteria) and any ART use. Within these two groups, study estimates are plotted in order of increasing ART use and then chronologically. Size of boxes is proportional to number of couples. Hugonnet et al 2002 (34) provides two per partnership estimates: one risk for partners of infected individuals at baseline and one risk for partners of individuals who seroconverted during follow-up. ART indicates reported percentage ART usage among index cases; Inc, per partnership HIV-1 incidence rate per 100 person-years; NR, not recorded in publication.
Figure 4
Figure 4
Incidence rate ratios for HIV incidence rate estimates from low-income countries for combined male-to-female female-to-male transmission, by ART coverage of index cases within each study. Estimates included in the analysis are shown in Figure 3A. Li et al (64) and Guthrie et al (62) are included in the no-versus-any-ART use scenario but excluded from the other IRR calculations because their level of ART coverage was not reported. Error bars represent 95% confidence intervals.

References

    1. UNAIDS/WHO [Accessed April 21st 2012];Global HIV/AIDS response. Epidemic update and health sector progress towards Universal Access. Progress report 2011. 2011 Available at: http://www.who.int/hiv/pub/progress_report2011/summary_en.pdf.
    1. Granich RM, Gilks CF, Dye C, De Cock KM, Williams BG. Universal voluntary HIV testing with immediate antiretroviral therapy as a strategy for elimination of HIV transmission: a mathematical model. Lancet. 2009 Jan 3;373(9657):48–57. - PubMed
    1. Cohen MS, Chen YQ, McCauley M, Gamble T, Hosseinipour MC, Kumarasamy N, et al. Prevention of HIV-1 Infection with Early Antiretroviral Therapy. N Engl J Med. 2011 Jul 18;365(6):493–505. - PMC - PubMed
    1. Shiboski SC, Padian NS. Epidemiologic evidence for time variation in HIV infectivity. J Acquir Immune Defic Syndr Hum Retrovirol. 1998 Dec 15;19(5):527–35. - PubMed
    1. Shiboski SC, Jewell NP. Statistical analysis of the time dependence of HIV infectivity based on partner study data. J Am Stat Assoc. 1992;87:360–72.

Publication types

Substances