. 2013 Jan 3;493(7430):45-50.
doi: 10.1038/nature11711. Epub 2012 Dec 5.

Genomic variation landscape of the human gut microbiome

Affiliations

Genomic variation landscape of the human gut microbiome

Siegfried Schloissnig et al. Nature. .

Abstract

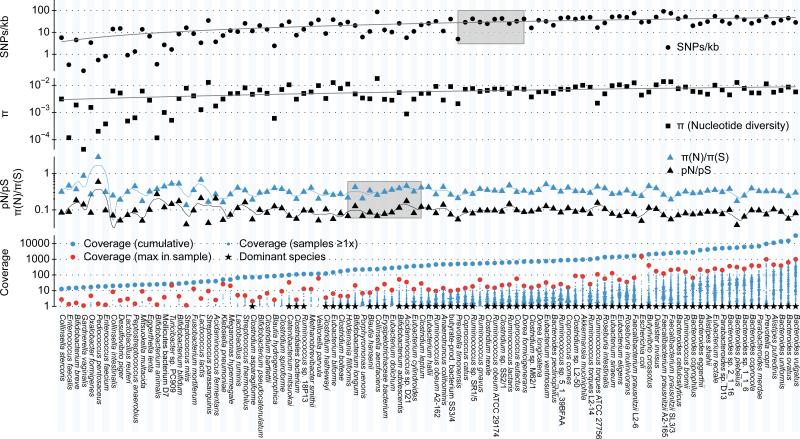
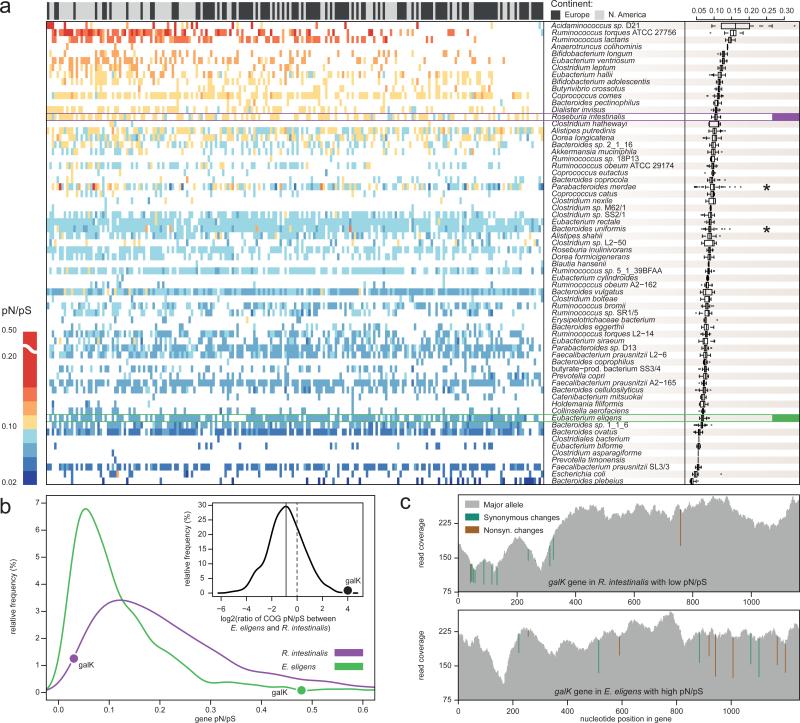
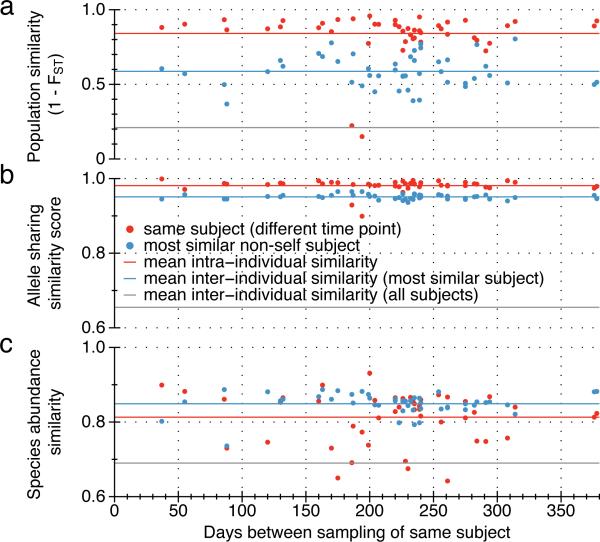
Whereas large-scale efforts have rapidly advanced the understanding and practical impact of human genomic variation, the practical impact of variation is largely unexplored in the human microbiome. We therefore developed a framework for metagenomic variation analysis and applied it to 252 faecal metagenomes of 207 individuals from Europe and North America. Using 7.4 billion reads aligned to 101 reference species, we detected 10.3 million single nucleotide polymorphisms (SNPs), 107,991 short insertions/deletions, and 1,051 structural variants. The average ratio of non-synonymous to synonymous polymorphism rates of 0.11 was more variable between gut microbial species than across human hosts. Subjects sampled at varying time intervals exhibited individuality and temporal stability of SNP variation patterns, despite considerable composition changes of their gut microbiota. This indicates that individual-specific strains are not easily replaced and that an individual might have a unique metagenomic genotype, which may be exploitable for personalized diet or drug intake.


Figures

Figure 1
Figure 1. Genomic variation statistics for 101 gut microbial species prevalent in 252 samples from 207 individuals
Genomic variation statistics were calculated for 101 prevalent gut microbial species, operationally defined as having ≥10x cumulative (over all samples) base pair coverage with at least one sample exhibiting a genome coverage of ≥40%. The 66 dominant species (indicated by *), which account for 99% of the mapped reads, were used for analyses that required high base pair coverage. Species names are given without strain specifications unless this would result in duplicate entries. The blue point cloud plots show the coverages (≥1x) in all samples, with the blue dot above indicating the cumulative coverage and the red dot the maximum coverage across all samples. Gray shaded areas indicate the level of base pair coverage at which abundance effects have only minor effects on SNPs/kb and pN/pS ratios of the pooled samples (Supplementary Information). SNP counts appear to saturate at approximately 500x, with minor increases at higher coverages likely due to the sampling of rare variants at low rates. In individual samples pN/pS is largely stable from a coverage of 10x onward (Supplementary Fig. 7), corresponding to approximately 200x cumulative coverage in our sample set. Nucleotide diversity π follows SNPs/kb closely, as does the derived measure of π(N)/π(S) with respect to pN/pS.
Figure 2
Figure 2. pN/pS ratios of 66 dominant species reveal more variation between species than between individuals
a) A heatmap of pN/pS ratios for the 66 dominant species (rows) and 207 individuals (columns; only the first time-point per individual) is shown and summarized by species (boxplots on the right). Rows and columns are ordered by their mean pN/pS ratios, which vary considerably between species, but have a tighter bandwidth across samples. Two genomes that are exceptions to this trend (indicated by *) might indicate higher strain diversity. The panel above the heatmap indicates the continent of residence for each individual. A significant difference was found in the mean pN/pS ratios between the two continents, although this is likely an effect of lower sequencing depths of European samples (Supplementary Table 8) that leads to missing data points in some samples (see for example top right corner). b) The distributions of average pN/pS ratios of individual genes from Roseburia intestinalis and Eubacterium eligens (both highlighted in (a)) illustrate that, while base pair coverages are similar, the pN/pS ratio of R. intestinalis is higher in general. The relative pN/pS ratios of orthologous groups in the two species are shown in the inset, the average log2 ratio indicated by the solid line and the random expectation by the dashed line. Outliers can be revealed this way, like the galactokinase gene (galK) whose pN/pS is among the lowest in R. intestinalis and the highest in E. eligens. c) Illustration of low and high pN/pS ratios in galK genes from R. intestinalis (top panel) and E. eligens (bottom panel). The cumulative read coverage is shown in grey with synonymous (green) and non-synonymous (brown) changes marked at the nucleotide positions they occur.
Figure 3
Figure 3. Individuality and temporal stability of genomic variation patterns
Samples from 43 individuals that were sampled at different time intervals (red dots) were compared with the most similar sample from a different individual (blue dots) in terms of (a) population similarity that takes allele frequencies into account, (b) allele sharing similarity score that takes SNP counts and the ratio of shared SNPs into account (Supplementary Information) and (c) species abundance similarity measured using the Jensen-Shannon Distance (JSD). Most similar sample is the one with the lowest FST value in (a), the highest allele sharing similarity score in (b) and the lowest JSD in (c). The three similarity measures are plotted against the number of days between the sampling time-points. The mean across all intra-individual, best inter-individual, and all inter-individual similarities are shown as red, blue, and green dashed lines. For both population similarity and allele sharing similarity between samples from the same individual, all but one sample (resulting in two outliers due to comparisons with two other time-points, see Supplementary Table 12) shared the highest similarity with another sample of the same individual providing strong evidence for individuality of SNP sharing patterns. No decline of similarity over time could be observed.
Figure 4
Figure 4. Inter-continental comparison of gut microbial species
Between continent FST values for eight genomes with ≥10 samples representing each continent are shown. Bacteroides coprocola was the species with the highest FST value, implying a separation between the B. coprocola populations in Europe and North America (see also Supplemental Material; all data available in Supplementary Table 14).

Comment in

References

    1. International HapMap Consortium A second generation human haplotype map of over 3.1 million SNPs. Nature. 2007;449:851–861. doi:10.1038/nature06258. - PMC - PubMed
    1. The 1000 Genomes Project Consortium A map of human genome variation from population-scale sequencing. Nature. 2010;467:1061–1073. doi:10.1038/nature09534. - PMC - PubMed
    1. Backhed F, Ley RE, Sonnenburg JL, Peterson DA, Gordon JI. Host-bacterial mutualism in the human intestine. Science. 2005;307:1915–1920. - PubMed
    1. Hooper LV, Midtvedt T, Gordon JI. How host-microbial interactions shape the nutrient environment of the mammalian intestine. Annu Rev Nutr. 2002;22:283–307. doi:10.1146/annurev.nutr.22.011602.092259. - PubMed
    1. Bagel S, Hüllen V, Wiedemann B, Heisig P. Impact of gyrA and parCMutations on Quinolone Resistance, Doubling Time, and Supercoiling Degree of Escherichia coli. Antimicrobial Agents and Chemotherapy. 1999;43:868–875. - PMC - PubMed

Publication types