. 2013 Jan;20(1):127-33.
doi: 10.1038/nsmb.2468. Epub 2012 Dec 9.

Global analysis of yeast mRNPs

Affiliations

Global analysis of yeast mRNPs

Sarah F Mitchell et al. Nat Struct Mol Biol. 2013 Jan.

Abstract

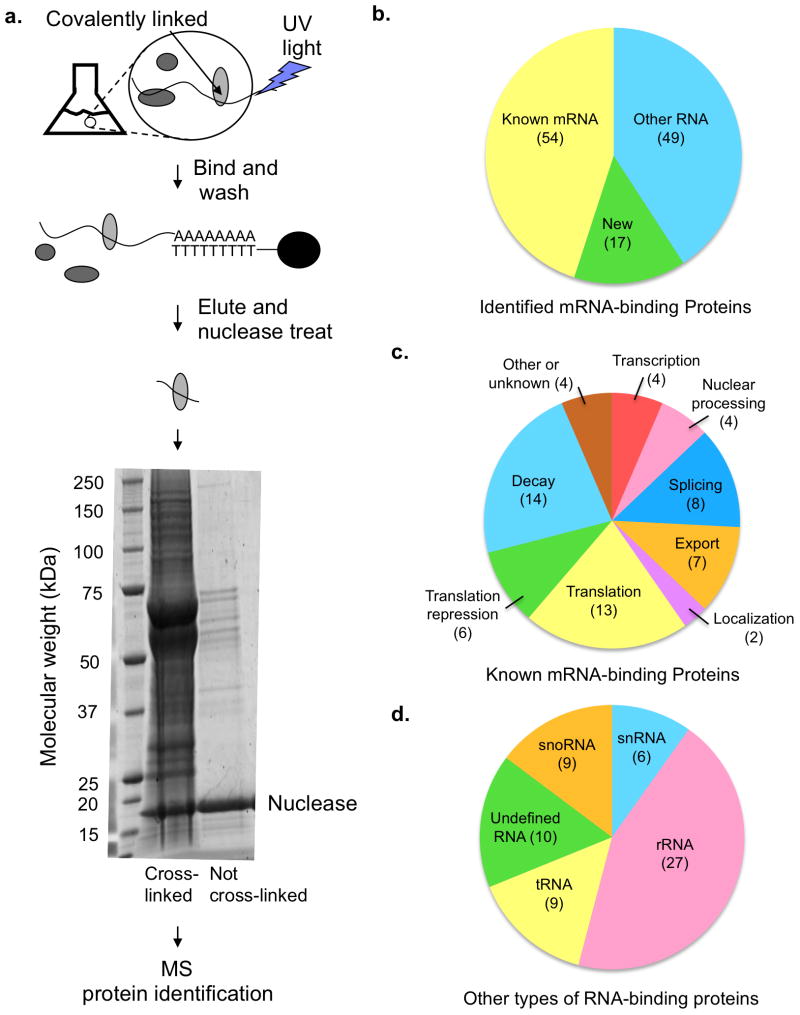
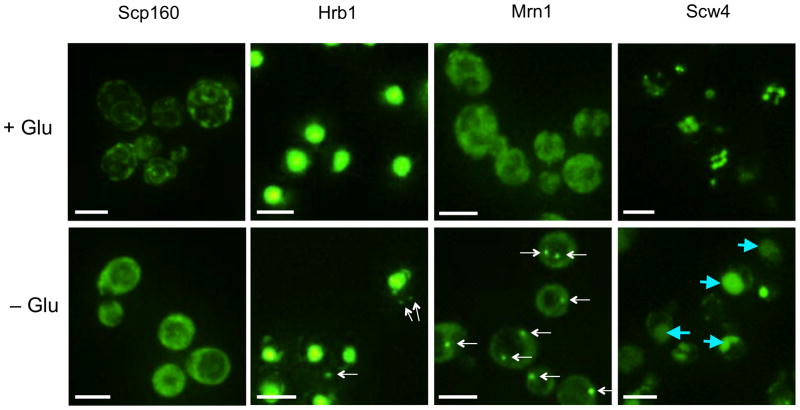
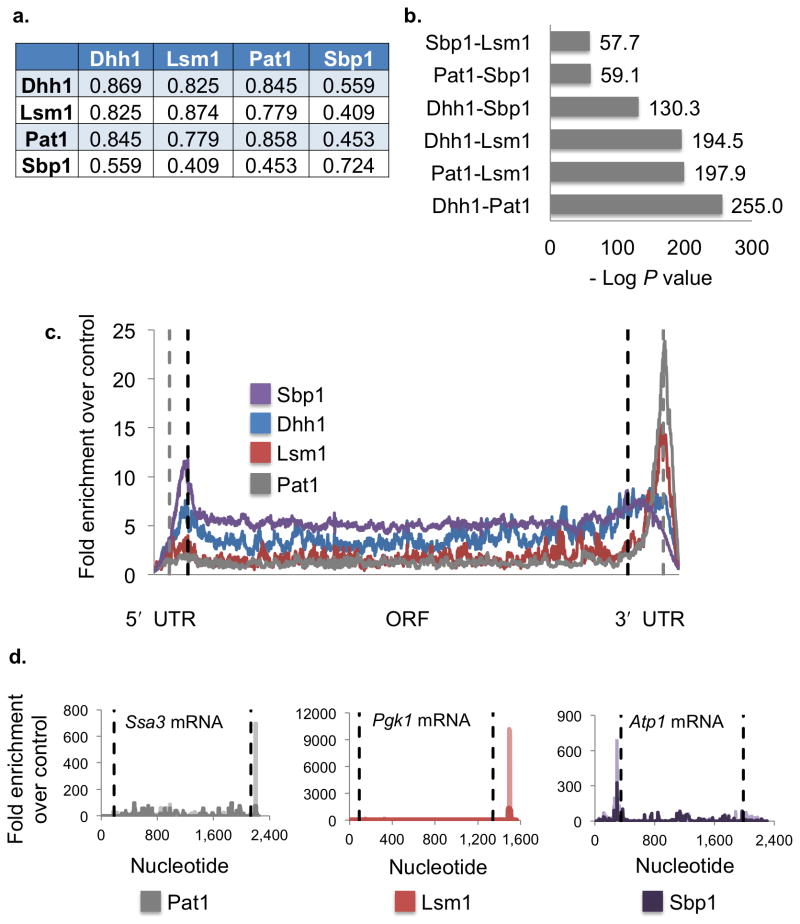
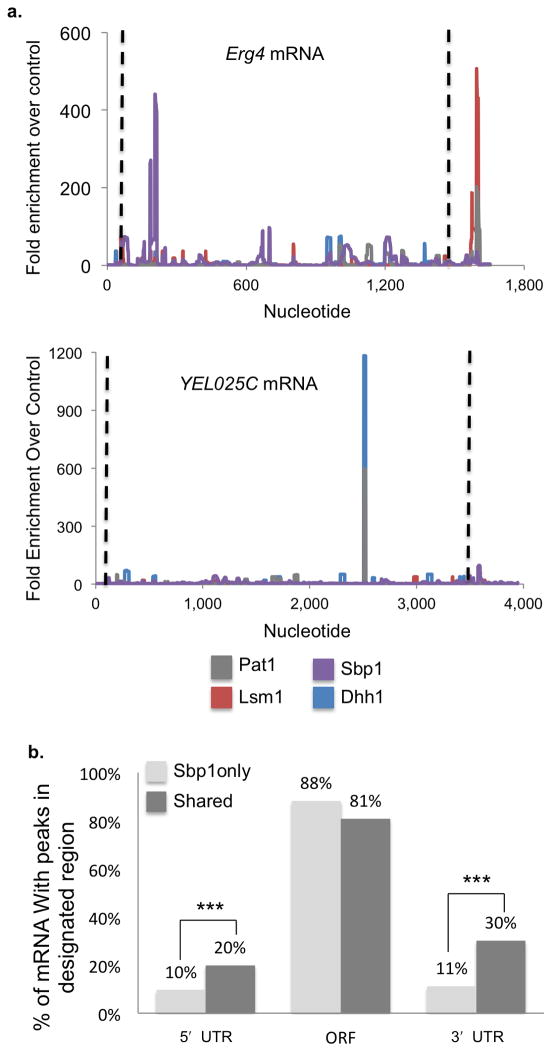
Proteins regulate gene expression by controlling mRNA biogenesis, localization, translation and decay. Identifying the composition, diversity and function of mRNA-protein complexes (mRNPs) is essential to understanding these processes. In a global survey of Saccharomyces cerevisiae mRNA-binding proteins, we identified 120 proteins that cross-link to mRNA, including 66 new mRNA-binding proteins. These include kinases, RNA-modification enzymes, metabolic enzymes and tRNA- and rRNA-metabolism factors. These proteins show dynamic subcellular localization during stress, including assembly into stress granules and processing bodies (P bodies). Cross-linking and immunoprecipitation (CLIP) analyses of the P-body components Pat1, Lsm1, Dhh1 and Sbp1 identified sites of interaction on specific mRNAs, revealing positional binding preferences and co-assembly preferences. When taken together, this work defines the major yeast mRNP proteins, reveals widespread changes in their subcellular location during stress and begins to define assembly rules for P-body mRNPs.


Conflict of interest statement

Competing Financial Interests

The authors declare no competing financial interests.

Figures

Figure 1
Figure 1
Description of the in vivo RBP capture procedure and identified mRNA binding proteins. (a) A schematic of in vivo capture of RBPs to identify mRNA binding proteins including an SDS PAGE gel stained with SYPRO Ruby dye. (b–d) Proteins identified by mass spectrometry (MS). Numbers in parentheses in parts (b–d) indicate the number of proteins in each category. Some proteins are found in multiple categories. (b) The distribution of 120 identified poly(A) RNA binding proteins between known mRNA binding proteins, new RNA binding proteins and new mRNA binding proteins previously known to interact with other types of RNA. (c) The functional categories of previously known mRNA binding proteins identified by the RBP capture assay. (Total of 54 proteins) (d) The types of RNA, other than mRNA, bound by the newly identified proteins (total of 49 proteins). For proteins closely associated with RNA biology, but for which a specific RNA binding partner has not been identified, or which are predicted to bind RNA based on structural homology to RNA binding proteins, the category “undefined RNA” has been used.
Figure 2
Figure 2
Fluorescence microscopy images to show localization of mRNA binding proteins fused to GFP under log phase growth (+Glu) and glucose deprivation conditions (−Glu). All white scale bars indicate 5 μm. Foci are indicated by white arrows. Vacuoles are indicated by blue arrows.
Figure 3
Figure 3
Categorization of new granule components. (a) Fluorescence microscopy of granule components of interest (Tae2, Sbp1 and Psp2) tagged with GFP. P-body marker Edc3 and stress granule marker Pub1 are tagged with mCherry. All white scale bars indicate 5 μm. White arrows indicate co-localizing GFP and mCherry foci. Blue arrows indicate GFP foci that do not co-localize with mCherry foci. Numbers in the upper right hand corner indicate the fraction of GFP foci that co-localize with mCherry foci averaged over three images. (b) Proteins are characterized as P-body or stress granule-like along a gradient based on fluorescence microscopy data, some of which are shown in (a). Orange indicates P-body-like characteristics and blue indicates stress granule-like features. Newly identified granule factors are marked with an asterisk. Numbers above the gradient represent fractional co-localization of granules with Pub1-mCherry granules averaged over three images.
Figure 4
Figure 4
P-body proteins bind to a shared group of mRNAs with positional specificity. (a) Pearson correlation coefficients for CLIP sequence counts of co-localized peaks between two data sets. Comparison with self indicates Pearson correlation coefficient for degree of similarity between the two replicates. (b) Bar graph showing degrees of similarity between the mRNA targets of Dhh1, Lsm1, Pat1 and Sbp1 identified by CLIP as −log P-values. (c) The enrichment of CLIP sequence tags over the control averaged across all bound mRNAs for each protein is shown. Sbp1 targets are shown in purple, Dhh1 in blue, Lsm1 in red, and Pat1 in gray. Limits of the open reading frame (ORF) are indicated by dashed black lines. Ends of the UTRs (untranslated regions) and beginnings of the extension regions are indicated by dashed gray lines. 50 nucleotide extensions regions were added to both ends of the transcript to account for annotation errors. Lengths are scaled to the average 5′ UTR, ORF and 3′ UTR lengths over the entire genome. (d) Plots showing enrichment of CLIP sequence tags over the control sequence data for individual mRNAs. Pat1 data is shown in gray for Ssa3 mRNA, Lsm1 in red for Pgk1 mRNA and Sbp1 is shown in purple for Atp1 mRNA. Dashed black lines indicate the limits of the open reading frame. Replicate data sets are shown in darker shades for each trace. Additional CLIP data sets for other proteins on the same mRNA are shown in Supplementary Fig. 2b.
Figure 5
Figure 5
Interactions between P-body proteins influence mRNA binding. (a) Plots showing enrichment of CLIP sequence tags over the control sequence data for individual mRNAs Erg4 and YEL025C. Dhh1 is shown in blue, Lsm1 in red, Pat1 in gray and Sbp1 in purple. Dashed black lines indicate the limits of the open reading frame. (b) Graph illustrating the percent of mRNA with CLIP sequence tag peaks in the 5′ UTR, open reading frame and 3′ UTR for Sbp1 target mRNA bound only by Sbp1 (light gray) or by other factors as well (“shared,” dark gray). Percentages do not add up to 100% as individual mRNA may have peaks in multiple regions. *** indicates P-value <0.0001 for unpaired Student’s t-test, n=755 mRNA for Sbp1 only, 294 mRNA for Shared.

References

    1. Schwanhäusser B, et al. Global quantification of mammalian gene expression control. Nature. 2011;473:337–342. - PubMed
    1. Tsvetanova NG, Klass DM, Salzman J, Brown PO. Proteome-wide search reveals unexpected RNA-binding proteins in Saccharomyces cerevisiae. PLoS ONE. 2010;5 - PMC - PubMed
    1. Matunis MJ, Matunis EL, Dreyfuss G. PUB1: a major yeast poly(A)+ RNA-binding protein. Molecular and cellular biology. 1993;13:6114–6123. - PMC - PubMed
    1. Castello A, et al. Insights into RNA Biology from an Atlas of Mammalian mRNA-Binding Proteins. Cell. 2012;149:1393–1406. - PubMed
    1. Baltz AG, et al. The mRNA-Bound Proteome and Its Global Occupancy Profile on Protein-Coding Transcripts. Molecular Cell. 2012;46:674–690. - PubMed

Publication types

MeSH terms