Review
. 2013 Jan;34(1):2-9.
doi: 10.1093/carcin/bgs382. Epub 2012 Dec 7.

Low-dose metabolism of benzene in humans: science and obfuscation

Affiliations
Review

Low-dose metabolism of benzene in humans: science and obfuscation

Stephen M Rappaport et al. Carcinogenesis. 2013 Jan.

Abstract

Benzene is a ubiquitous air pollutant that causes human leukemia and hematotoxic effects. Although the mechanism by which benzene causes toxicity is unclear, metabolism is required. A series of articles by Kim et al. used air and biomonitoring data from workers in Tianjin, China, to investigate the dose-specific metabolism (DSM) of benzene over a wide range of air concentrations (0.03-88.9 p.p.m.). Kim et al. concluded that DSM of benzene is greatest at air concentrations <1 p.p.m. This provocative finding motivated the American Petroleum Institute to fund a study by Price et al. to reanalyze the original data. Although their formal 'reanalysis' reproduced Kim's finding of enhanced DSM at sub-p.p.m. benzene concentrations, Price et al. argued that Kim's methods were inappropriate for assigning benzene exposures to low exposed subjects (based on measurements of urinary benzene) and for adjusting background levels of metabolites (based on median values from the 60 lowest exposed subjects). Price et al. then performed uncertainty analyses under alternative approaches, which led them to conclude that '… the Tianjin data appear to be too uncertain to support any conclusions …' regarding the DSM of benzene. They also argued that the apparent low-dose metabolism of benzene could be explained by 'lung clearance.' In addressing these criticisms, we show that the methods and arguments presented by Price et al. are scientifically unsound and that their results are unreliable.


Figures

Fig. 1.
Fig. 1.
Dose-specific metabolism of benzene as indicated by measurements of benzene metabolites in urine from Tianjin subjects after background adjustment. Closed circles show data aggregated by estimated benzene exposures (30 subjects per group) with error bars representing 5th and 95th percentiles of bootstrap distributions (18). The dashed curve represents the natural spline model of individual subjects’ (geometric mean) benzene exposures between 0.03 and 88.9 p.p.m. (19). Open circles and error bars are 50th, 10th and 90th percentiles of bootstrap distributions (Supplementary Material, Table S.1, available at Carcinogenesis Online).
Fig. 2.
Fig. 2.
Air concentrations of benzene observed across 386 subjects in the Tianjin dataset under different approaches for defining background samples. For each approach (shown at the bottom), exposure data are presented at left for subjects comprising background samples and at right for the remaining subjects available for modeling exposure–metabolite relationships.
Fig. 3.
Fig. 3.
Comparing uncertainty analyses of Kim et al. (19) with and without consideration of uncertainty from the calibration model (from Supplementary Material, Tables S.1 and S.2, available at Carcinogenesis Online). The open circles and error bars represent the 50th, 10th and 90th percentiles of bootstrap distributions (Supplementary Table S.1, available at Carcinogenesis Online), reproducing the original analyses of Kim et al., without considering uncertainty from the calibration model. The solid and dashed curves in Supplementary Figure S.1, available at Carcinogenesis Online, represent the corresponding 50th, 10th and 90th percentiles of new bootstrap distributions, which include uncertainty from the calibration model (Supplementary Table S.2, available at Carcinogenesis Online). Comparing the two sets of results, it is apparent that uncertainties from the calibration model contributed only trivially to the bootstrap distributions.
Fig. 4.
Fig. 4.
Reproduction of Figure 2 from Price et al. showing box-and-whisker plots of bootstrap distributions for ratios of total metabolite production (TMP) at benzene concentrations of 0.03 and 88.9 p.p.m. (Note that Price et al.’s TMP is equivalent to ‘DSM’ in this article). Values of TMP ratios designated with Xs were added by the authors of this article to identify point estimates for data distributions given by Price et al. (p. 2096 in the first two paragraphs under ‘Results’).
Fig. 5.
Fig. 5.
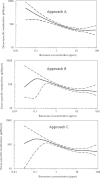
Comparing uncertainty analyses for natural spline models of total metabolite concentrations as functions of subject-specific geometric mean air concentrations under Price et al.’s Approaches A, B and C (from Supplementary Material, Tables S.2, S.3 and S.4, available at Carcinogenesis Online). The solid curves represent 50th percentiles of bootstrap distributions and the dashed curves represent 10th and 90th percentiles of bootstrap distributions.
Fig. 6.
Fig. 6.
Predictions of dose-specific metabolism based on measurements of benzene concentrations in inhaled and exhaled air from four published studies (51–54) juxtaposed with the modeling results of Kim et al. given in Supplementary Material (Table S.2), available at Carcinogenesis Online. The inhaled/exhaled air studies are described in Supplementary Material (Section 3) and the data and calculations are given in Table S.6, available at Carcinogenesis Online.

Comment on

References

    1. IARC (2012). Chemical Agents and Related Occupations, Volume 100 F, A Review of Human Carcinogens, International Agency for Research on Cancer; Lyon, France:
    1. Lan Q., et al. (2004). Hematotoxicity in workers exposed to low levels of benzene. Science, 306, 1774–1776 - PMC - PubMed
    1. Schnatter A.R., et al. (2012). Myelodysplastic syndrome and benzene exposure among petroleum workers: an international pooled analysis. J. Natl. Cancer Inst, J Natl Cancer Inst. 2012 Nov 21; 104(22):1724–37 doi: 10.1093/jnci/djs411. Epub 2012 Oct 30. - PMC - PubMed
    1. Weisel C.P. (2010). Benzene exposure: an overview of monitoring methods and their findings. Chem. Biol. Interact., 184, 58–66 - PMC - PubMed
    1. Ross D. (2000). The role of metabolism and specific metabolites in benzene-induced toxicity: evidence and issues. J. Toxicol. Environ. Health Part A, 61, 357–372 - PubMed