. 2013 Mar;62(3):855-63.
doi: 10.2337/db12-0399. Epub 2012 Dec 6.

Inverse regulation of inflammation and mitochondrial function in adipose tissue defines extreme insulin sensitivity in morbidly obese patients

Affiliations

Inverse regulation of inflammation and mitochondrial function in adipose tissue defines extreme insulin sensitivity in morbidly obese patients

Mohammed Qatanani et al. Diabetes. 2013 Mar.

Abstract

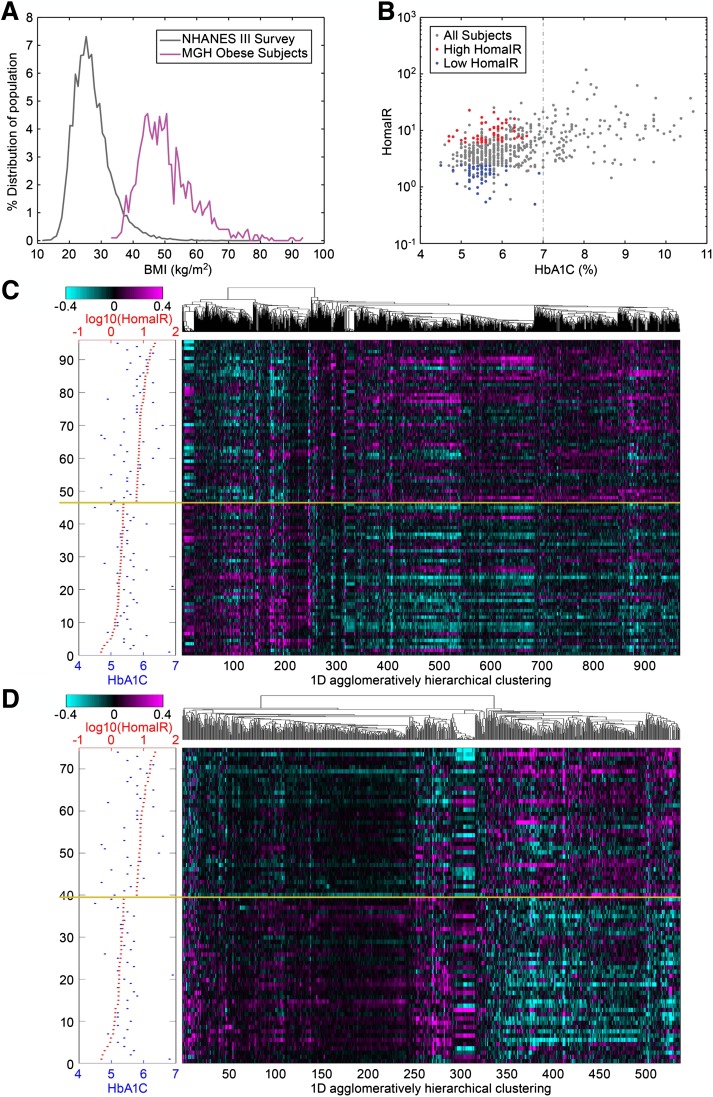
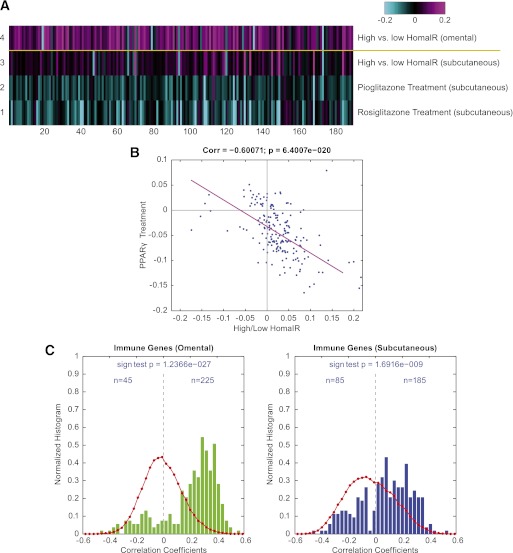
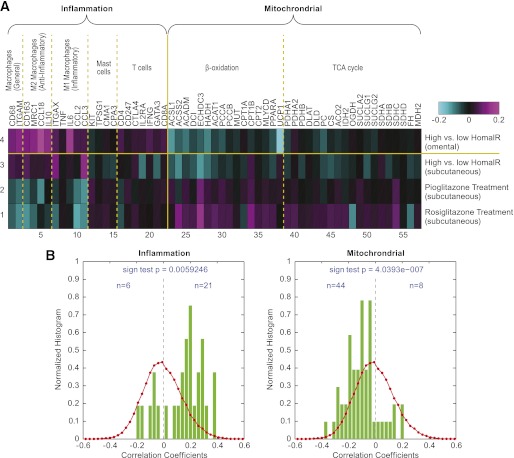
Obesity is associated with insulin resistance, a major risk factor for type 2 diabetes and cardiovascular disease. However, not all obese individuals are insulin resistant, which confounds our understanding of the mechanistic link between these conditions. We conducted transcriptome analyses on 835 obese subjects with mean BMI of 48.8, on which we have previously reported genetic associations of gene expression. Here, we selected ~320 nondiabetic (HbA(1c) <7.0) subjects and further stratified the cohort into insulin-resistant versus insulin-sensitive subgroups based on homeostasis model assessment-insulin resistance. An unsupervised informatics analysis revealed that immune response and inflammation-related genes were significantly downregulated in the omental adipose tissue of obese individuals with extreme insulin sensitivity and, to a much lesser extent, in subcutaneous adipose tissue. In contrast, genes related to β-oxidation and the citric acid cycle were relatively overexpressed in adipose of insulin-sensitive patients. These observations were verified by querying an independent cohort of our published dataset of 37 subjects whose subcutaneous adipose tissue was sampled before and after treatment with thiazolidinediones. Whereas the immune response and inflammation pathway genes were downregulated by thiazolidinedione treatment, β-oxidation and citric acid cycle genes were upregulated. This work highlights the critical role that omental adipose inflammatory pathways might play in the pathophysiology of insulin resistance, independent of body weight.


Figures

FIG. 1.
FIG. 1.
A: The BMI distribution curve (magenta) for patients who were involved in the RYGB profiling experiments, and the BMI distribution curve (gray) for the general population in National Health and Nutrition Examination Survey (NHANES) III survey. B: A dot plot comparing HOMA-IR trait vs. HbA1c trait for the patients who were involved in our profiling studies (nondiabetic, did not use any medicine, and had HbA1c <7%; gray). The red dots represent patients who had higher HOMA-IR level (top 15%), the blue dots represent patients who had lower HOMA-IR level (bottom 15%) among the patients included in the profiling analysis. C: A heat map showing the one-dimensional histogram of the 968 selected omental genes that differentiate between high and low HOMA-IR levels in the unsupervised analysis. Magenta in the heat map indicates upregulation and cyan indicates downregulation for the individual patient sample compared with the pool of all patient samples. D: A heat map showing the one-dimensional histogram of the 546 selected subcutaneous genes that differentiate between high and low HOMA-IR levels in the unsupervised analysis. The methodology used for calculating the algorithms for unsupervised clustering can be found in the Supplementary Materials. (A high-quality digital representation of this figure is available in the online issue.)
FIG. 2.
FIG. 2.
A: Heat map showing the expression of the known immune function genes in the omental and subcutaneous tissues of patients with high vs. low HOMA-IR levels in the RYGB profiling experiments and in the subcutaneous tissues of a different cohort of diabetic and nondiabetic subjects who received pioglitazone and rosiglitazone treatments in the peroxisome proliferator–activated receptor γ (PPARγ) profiling experiment. The data shown are the average of log10 of the ratio of gene expression between the high HOMA-IR patient group and the low HOMA-IR patient group for RYGB cohort, and the average of log10 of the ratio of gene expression for patients receiving PPARγ treatments and without PPARγ treatment for the PPARγ study cohort. B: Dot plot analysis showing the comparison of correlation coefficients between gene expression and HOMA-IR level in the RYGB profiling experiments vs. the correlation coefficients between gene expression and HOMA-IR level in the PPARγ profiling experiment for the known immune function genes. The magenta line is the least-squares fitted line for the comparison dot plot. C: Bar charts showing the evenness of the distribution of correlation coefficients for the expression of immune genes and WBCs in omental tissue (left, green) and in subcutaneous tissue (right, blue). The number of genes in each bin in the raw histogram is divided by the total number of genes in all bins to give the normalized histogram. The red curves are the distribution of correlation coefficients for all 44 K array genes with WBCs. (A high-quality digital representation of this figure is available in the online issue.)
FIG. 3.
FIG. 3.
A: Heat map showing the expression of the literature-curated inflammation and mitochondrial function genes in the RYGB and peroxisome proliferator–activated receptor γ (PPARγ) profiling experiments. As in Fig. 2, the data shown are the average of log10 of the ratio of gene expression between the high HOMA-IR patient group and the low HOMA-IR patient group for RYGB cohort, and the average of log10 of the ratio of gene expression for patients receiving PPARγ treatments and those without PPARγ treatment for the PPARγ study cohort. B: Bar charts showing the evenness of the distribution of correlation coefficients for the relationships between expression of inflammation genes (left) and WBC count, and for the relationships between expression of mitochondrial function genes (right) and WBC count. The number of genes in each bin in the raw histogram is divided by the total number of genes in all bins to give the normalized histogram. The red curves are the distribution of correlation coefficients for the relationships between expression of all 44 K array genes and WBC count. (A high-quality digital representation of this figure is available in the online issue.)

References

    1. Li Z, Bowerman S, Heber D. Health ramifications of the obesity epidemic. Surg Clin North Am 2005;85:681–701 - PubMed
    1. Olshansky SJ. Projecting the future of U.S. health and longevity. Health Aff (Millwood) 2005;24(Suppl 2):W5R86–89 - PubMed
    1. American Diabetes Association. Diabetes statistics. 2011. Available from http://www.diabetes.org/diabetes-statistics/prevalence.jsp Accessed 21 August 2011
    1. Zimmet P, Alberti KG, Shaw J. Global and societal implications of the diabetes epidemic. Nature 2001;414:782–787 - PubMed
    1. Flier JS. Obesity wars: molecular progress confronts an expanding epidemic. Cell 2004;116:337–350 - PubMed

MeSH terms