

doi: 10.1038/nmeth.2277.
Epub 2012 Dec 9.
Fast multicolor 3D imaging using aberration-corrected multifocus microscopy
Affiliations
- PMID: 23223154
- PMCID: PMC4161287
- DOI: 10.1038/nmeth.2277
Item in Clipboard
Fast multicolor 3D imaging using aberration-corrected multifocus microscopy
Nat Methods.
2013 Jan.
Abstract
Conventional acquisition of three-dimensional (3D) microscopy data requires sequential z scanning and is often too slow to capture biological events. We report an aberration-corrected multifocus microscopy method capable of producing an instant focal stack of nine 2D images. Appended to an epifluorescence microscope, the multifocus system enables high-resolution 3D imaging in multiple colors with single-molecule sensitivity, at speeds limited by the camera readout time of a single image.
Conflict of interest statement
The authors declare no competing financial interests.
Figures

Aberration-corrected multi-focus microscopy (MFM). (a) The
multi-focus optical elements are appended to a widefield fluorescence microscope
after the primary image plane (at the camera port). Two relay lenses
(f1=150 and f2=200 mm) create a
conjugate pupil plane (Fourier plane) and the final image plane. The multi-focus
grating (MFG) is placed in the Fourier plane and followed by the chromatic
correction grating (CCG) and prism. A dichroic mirror (purple) splits the color
channels onto separate cameras. (b) The MFG splits and focus shifts
the sample emission light to form an instant focal series (the multi-focus
image) where each focal plane corresponds to a diffractive order of the MFG. Ray
colors denote individual focal planes (diffractive orders). The CCG and prism
correct the chromatic dispersion, illustrated by rays of wavelengths
λmax and λmin, introduced by the MFG.
(c) The instant focal stack recorded on the camera is
computationally assembled into a 3D volume in a computer. (d) The
MFG is a phase-only diffractive grating with etch depth π. The grating
function (basic grating pattern) is optimized to distribute light evenly into
the central 3 × 3 diffractive orders (mx,
my = 0, ±1), which form the nine
focal planes. The geometrical distortion of the MFG pattern introduces a phase
shift which is dependent on diffractive order, and in the image corresponds to a
focus shift Δz ×
(mx + 3 ×
my). The CCG panels (except the blank, central
panel) contain blazed diffractive gratings that reverse the dispersion of the
MFG. The prism directs the images to their positions on the camera.
(e) Multi-focus image of 200 nm fluorescent beads Δz
= 380 nm. (f) Axial (x-z) point spread function (PSF),
radially averaged and displayed in log scale. Resolution measured as full width
at half maximum of the PSF is 238 nm laterally (x) and 660 nm axially (z).
(g) Best focus position is estimated as the maximum of a
Gaussian curve fitted to the bead signal when scanned through focus by the stage
(Supplementary Video
1). (h) Plot of the best focus position of each plane.
The linear curve verifies the constant focus step Δz betweenplanes.
Scale bars 1μm.

Centromere imaging in yeast cells. (a) and (b)
Multi-focus transmission and fluorescence images of S.
cerevisiae cells expressing Cse4-GFP. (c) Separation
of the centromeres during anaphase over time (maximum intensity projections).
(d) Movement in 3D of the two centromere clusters (in black and
gray). The correlated 3D motion of the clusters can be seen clearly. Lower
right: the separation rate of centromere clusters reveals a two-phase process,
with a rapid movement (phase I) followed by a slow one (phase II). Insert:
average speed during phases I and II (n = 5 cells).
Scale bars 5 μm.
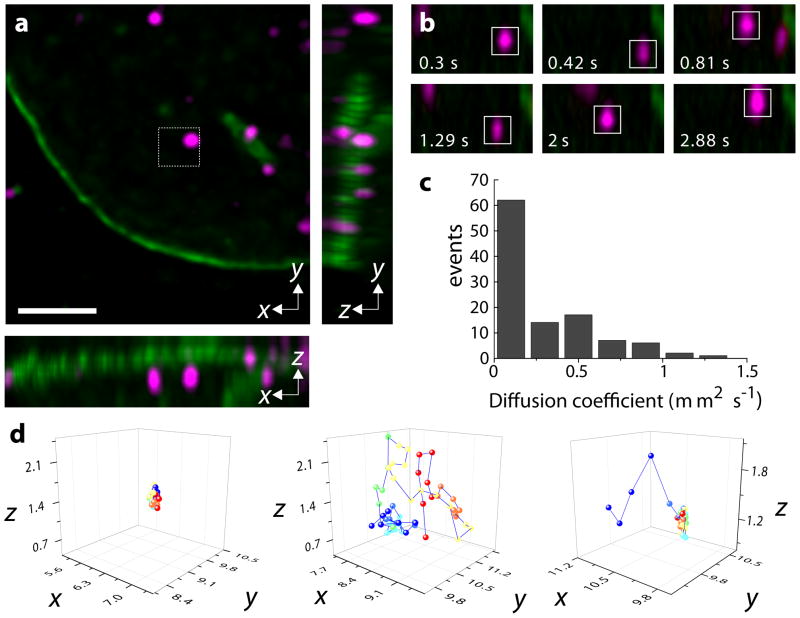
Single-molecule tracking of RNA Polymerase II. (a) Maximum Intensity
Projection (MIP) of the 3D volume of the first frame of Supplementary Video 5 on the x-y,
x-z and y-z planes. Magenta spots correspond to single Halo-tagged RNA
Polymerase II molecules in U2OS cells. The nuclear membrane (green) is
visualized using LaminB1-GFP. Scale bar 5 μm. (b) Movement
of the single molecule marked by the dashed frame in a, visualized
in MIP in the x-z plane. (Same scale as in a). (c)
Histogram of diffusion coefficient (n = 109 molecules,
from 7 cells). (d) Examples of individual trajectories of RNA
Polymerase II. From left to right showing a bound molecule, a diffusing molecule
and a molecule with mixed dynamics. Dimensions are in μm. Corresponding
3D temporal sequences are available in Supplementary Video 6.
