. 2012 Dec 5;32(49):17830-41.
doi: 10.1523/JNEUROSCI.6334-11.2012.

Improving visual perception through neurofeedback

Affiliations

Improving visual perception through neurofeedback

Frank Scharnowski et al. J Neurosci. .

Abstract

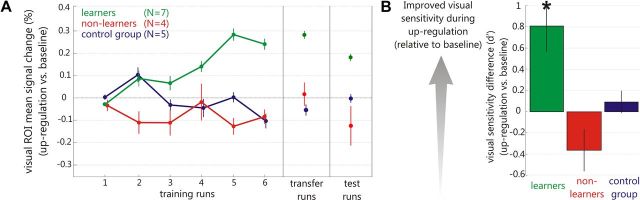
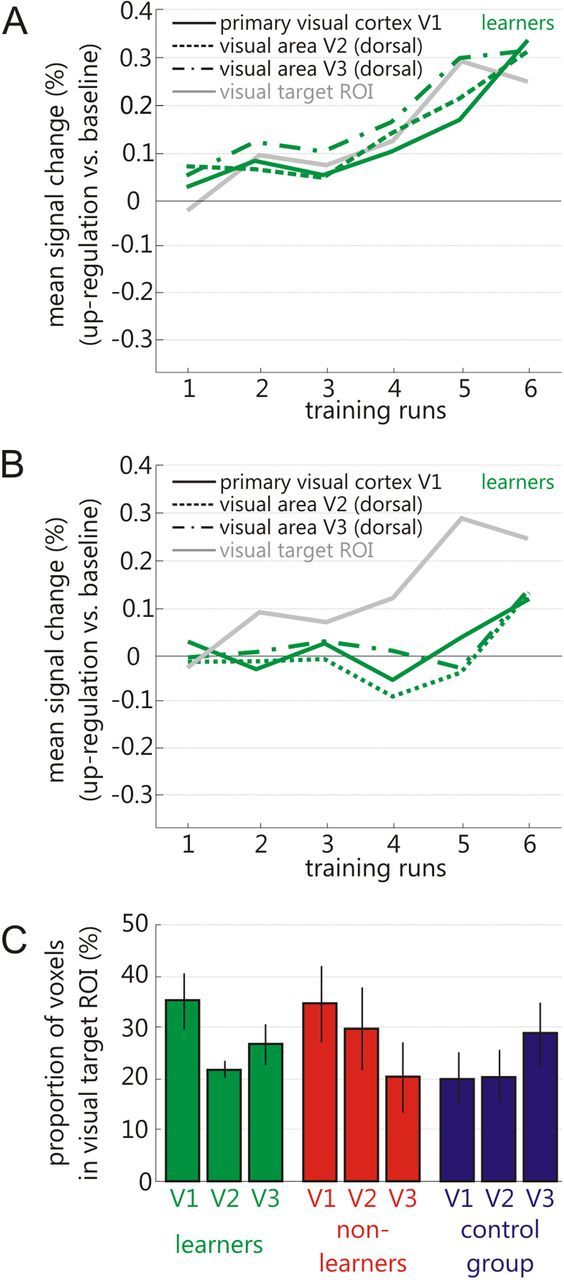
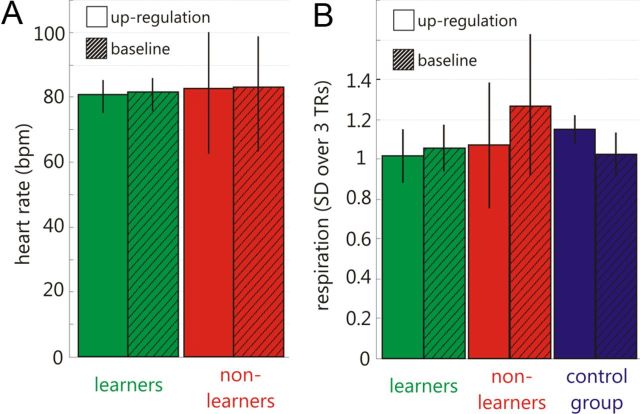
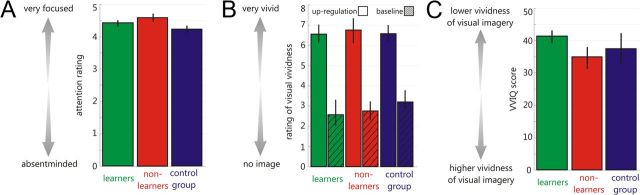
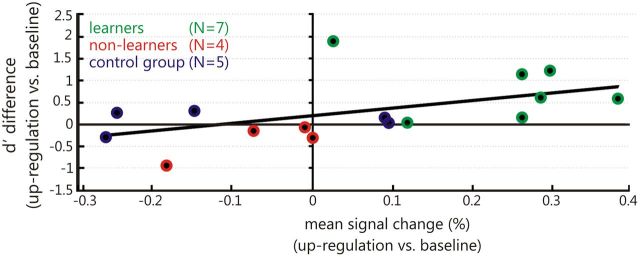
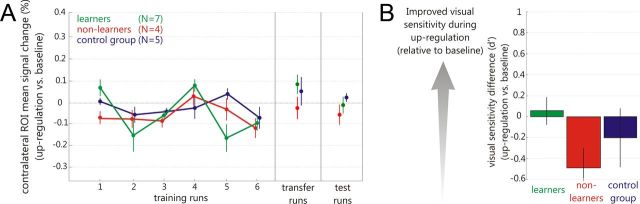
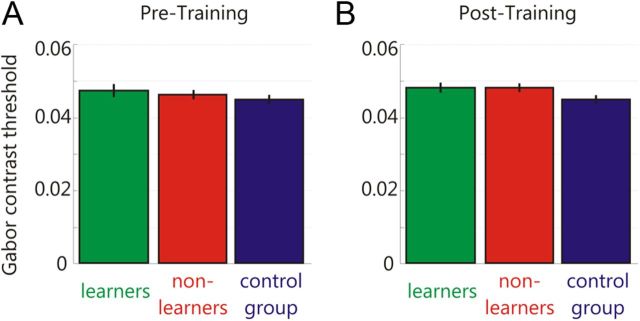
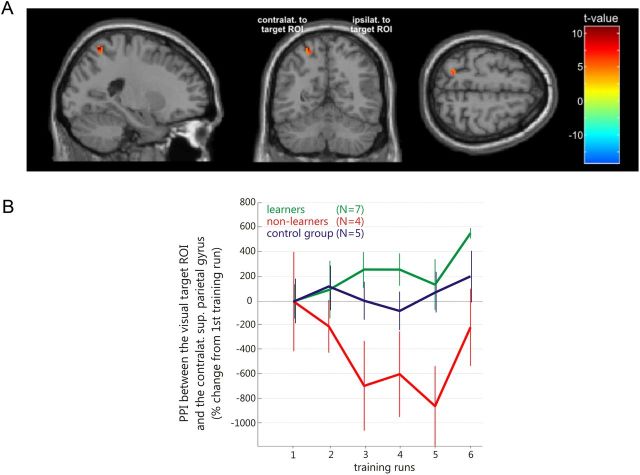
Perception depends on the interplay of ongoing spontaneous activity and stimulus-evoked activity in sensory cortices. This raises the possibility that training ongoing spontaneous activity alone might be sufficient for enhancing perceptual sensitivity. To test this, we trained human participants to control ongoing spontaneous activity in circumscribed regions of retinotopic visual cortex using real-time functional MRI-based neurofeedback. After training, we tested participants using a new and previously untrained visual detection task that was presented at the visual field location corresponding to the trained region of visual cortex. Perceptual sensitivity was significantly enhanced only when participants who had previously learned control over ongoing activity were now exercising control and only for that region of visual cortex. Our new approach allows us to non-invasively and non-pharmacologically manipulate regionally specific brain activity and thus provide "brain training" to deliver particular perceptual enhancements.


Figures

Figure 1.
Figure 1.
Experimental design overview. In the first scanning session, a high-resolution structural scan was acquired, and the visual target ROI was defined with a functional localizer. After receiving written instructions, participants underwent several sessions of neurofeedback training (on separate days). Per session, participants did an average of approximately two feedback runs of 8.3 min each. A feedback run was composed of 38 s baseline blocks (gray) interleaved with 38 s upregulation blocks (red). After the training, participants tried self-regulation in the absence of feedback (transfer run). The behavioral testing was performed in several separate scanning sessions spread over the course of several days. To test the effect of self-regulation on behavior, participants were required to detect the presence of near-threshold stimuli at different positions in the visual field while exerting voluntary control over activity in the target ROI. We hypothesized that participants who learned to increase activity in their left/right visual cortex would improve in visual sensitivity in the contralateral but not in the ipsilateral visual field (visual stimuli are processed in the contralateral visual cortex).
Figure 2.
Figure 2.
Flow of data in the neurofeedback experiment. Sixteen healthy volunteers were trained to learn to control local visual cortex activation with the help of neurofeedback. Brain activation was measured with a 3 T Siemens Allegra MR scanner using the BOLD effect, which detects the neurovascular response to brain activation. Data preprocessing (e.g., 3D head motion correction) and analysis (e.g., percentage of signal change calculation) were performed online with Turbo-BrainVoyager (Brain Innovation) and custom-made software. Custom-made software was used to continuously provide visual feedback of local brain activation to the participant in the scanner. The neurofeedback display consisted of a thermometer, and the temperature reading indicated the current level of activity in the visual cortex ROI. A dashed line indicated the target activation level, which could either be high (upregulation condition) or low (baseline condition).
Figure 3.
Figure 3.
Neurofeedback training and behavioral effects of self-regulation. A, Visual ROI regulation success was measured as the mean percentage signal change in the upregulation blocks compared with the baseline blocks. The seven learners showed an increase in visual cortex control with training that was maintained during transfer and behavioral test runs. The non-learners and the controls did not learn to control their visual cortex activity. B, Visual sensitivity (d′) of the learners improved significantly in the upregulation compared with the baseline blocks. The non-learners showed a nonsignificant decrease in visual sensitivity, and the controls showed no difference in visual sensitivity. Error bars represent 1 SEM.
Figure 4.
Figure 4.
Composition of visual target ROI. A, Learning is found in all subregions of the visual target ROI, i.e., there is no significant difference between V1, V2, and V3 voxel components of the visual target ROI. B, Self-regulation of visual cortex activity is confined to the parts of V1, V2, and V3 that overlap with the visual target ROI and is not found in all V1, V2, and V3 voxels of the corresponding quadrant (depending on the location of the visual target ROI activity in either the left or right dorsal portions of the visual regions are shown). For comparison, the learning curve for the visual target ROI is plotted in gray. Error bars represent 1 SEM. C, The proportion of V1, V2, and V3 voxels that constitute the visual target ROI is not significantly different between the experimental groups. Also, the proportion of V1, V2, and V3 voxels does not correlate with learning success in terms of achieved signal change in the last training run (V1: Pearson's correlation, r(14) = 0.04, p = 0.89, n = 16; V2: Pearson's correlation, r(14) = −0.16, p = 0.57, n = 16; V3: Pearson's correlation, r(14) = 0.02, p = 0.94, n = 16).
Figure 5.
Figure 5.
Physiological measures show no difference between upregulation and baseline blocks. A, Mean heart beat is not different between conditions (upregulation/baseline) and experimental groups (learners/non-learners; because of technical problems, there is insufficient data for the controls). B, Mean respiration, plotted as the SD over 3 TRs (Birn et al., 2008; Chang et al., 2009), is not different between conditions (upregulation/baseline) and experimental groups (learners/non-learners/controls). Error bars represent 1 SEM.
Figure 6.
Figure 6.
Examples of visual imagery. As part of the debriefing after the neurofeedback training sessions, participants depicted the contents and locations of their imagery. Verbally, participants described their imagery as follows (from top left to bottom right): learners, “I imagined pictures of someone I like.”/“I saw pictures in the fuzz.”/“I imagined various spinning wheels and moving spirals.”/“I was observing a model with a fancy wedding dress walking down the stage.”/“I imagined details of my cat moving.”; non-learners, “I imagined people doing various things.”/“I imagined trees and a road leading to an entrance of a building.”/“I imagined Tinkerbell movies.”/“I imagined writing my name.”; controls, “I imagined viewing a dental cast in different angles.”/“I imagined a beach at the ocean.”/“I imagined me running in a park.”/“I imagined a fish.” For illustration purposes, an orange circle indicates the location corresponding to the visual target ROI; this circle was not presented to the participants. Please note that two participants from the learner group and one from the control group frequently changed strategies and were therefore not able to provide a representative drawing/description of their imagery.
Figure 7.
Figure 7.
Attentional effort and vividness of visual imagery. A, After the training sessions, participants rated on a scale from 1 to 5 if they were focused or absent-minded during the training runs. There was no significant difference with respect to their attentional involvement between the experimental groups (one-way ANOVA: F(2,13) = 0.23, df = 15, p = 0.80). B, After the training sessions, participants rated their visual vividness during upregulation and baseline blocks on a scale from 1 to 8. Vividness was not different between the experimental groups, and it was much higher during the upregulation blocks compared with the baseline blocks (some participants reported some weak visual imagery of numbers while counting backward during the baseline blocks). C, Before the neurofeedback training, participants performed the VVIQ, which is a standard test to measure individual differences in vividness of visual imagery (Marks, 1973, 1995). Please note that higher VVIQ scores indicate lower vividness of the visual imagery. There was no significant difference of visual image vividness between the experimental groups (one-way ANOVA: F(2,13) = 0.79, df = 15, p = 0.47). Error bars represent 1 SEM.
Figure 8.
Figure 8.
Changes in visual sensitivity correlate with changes in visual cortex activity. There is a significant positive correlation between self-regulated activity in the visual target ROI (i.e., the signal change differences between upregulation and baseline blocks in the last training run) and visual sensitivity (i.e., the d′ differences between upregulation and baseline blocks; Pearson's correlation, r(14) = 0.51, p = 0.04, n = 16).
Figure 9.
Figure 9.
No learning and behavioral effects in the contralateral homolog of the ROI. A, Regulation success in the homolog of the visual target ROI in the corresponding location of the contralateral lower visual field was measured as the mean percentage signal change in the upregulation blocks compared with the baseline blocks. None of the participants showed an increase in the contralateral visual cortex with training, during transfer, nor during behavioral test runs. B, Visual sensitivity (d′) of the learners, the non-learners, and the controls was not significantly different in the upregulation compared with the baseline blocks. Error bars represent 1 SEM.
Figure 10.
Figure 10.
Behavioral effects without self-regulation. To test whether neurofeedback training led to general perceptual improvements that are independent of actively upregulating visual cortex activity, we measured each participant's perceptual threshold before (A) and after (B) the neurofeedback training in the MR scanner. Thresholds were not different between the experimental groups or over time.
Figure 11.
Figure 11.
Regions with differential connectivity to the visual target ROI attributable to self-regulation. A, A PPI analysis of the learner's last training runs revealed stronger correlations between the visual target ROI and the contralateral superior parietal cortex [MNI coordinates, (22, −58, 63)] and weaker correlations with the ipsilateral middle frontal gyrus [not shown for clarity; MNI coordinates, (38, 48, 0)] as well as with the contralateral superior temporal gyrus [not shown for clarity; MNI coordinates, (56, −29, 17)]. Please note that, for this exploratory analysis, the statistical parametric maps were thresholded at p = 0.001 (uncorrected). Please also note that, to allow for group comparisons, the images of the participant whose target ROI was in the left visual cortex had been flipped, and therefore the right hemisphere in the illustration refers to the hemisphere ipsilateral to the visual target ROI. B, In the learners, the PPI between the contralateral SPL and the visual target ROI increased significantly with training. Such training-related changes in connectivity were not found in the non-learners and in the controls. No significant changes with training were found for the middle frontal gyrus and the superior temporal gyrus. Error bars represent 1 SEM.

Comment in

References

    1. Allen JJ, Harmon-Jones E, Cavender JH. Manipulation of frontal EEG asymmetry through biofeedback alters self-reported emotional responses and facial EMG. Psychophysiology. 2001;38:685–693. - PubMed
    1. Arieli A, Sterkin A, Grinvald A, Aertsen A. Dynamics of ongoing activity: eplanation of the large variablity in evoked cortical responses. Science. 1996;273:1868–1871. - PubMed
    1. Ashburner J. A fast diffeomorphic image registration algorithm. Neuroimage. 2007;38:95–113. - PubMed
    1. Birbaumer N, Ghanayim N, Hinterberger T, Iversen I, Kotchoubey B, Kübler A, Perelmouter J, Taub E, Flor H. A spelling device for the paralysed. Nature. 1999;398:297–298. - PubMed
    1. Birn RM, Smith MA, Jones TB, Bandettini PA. The respiration response function: the temporal dynamics of fMRI signal fluctuations related to changes in respiration. Neuroimage. 2008;40:644–654. - PMC - PubMed

Publication types

LinkOut - more resources