

Immune modulation of effector CD4+ and regulatory T cell function by sorafenib in patients with hepatocellular carcinoma
- PMID: 23223899
- PMCID: PMC3863727
- DOI: 10.1007/s00262-012-1380-8
Immune modulation of effector CD4+ and regulatory T cell function by sorafenib in patients with hepatocellular carcinoma
Abstract
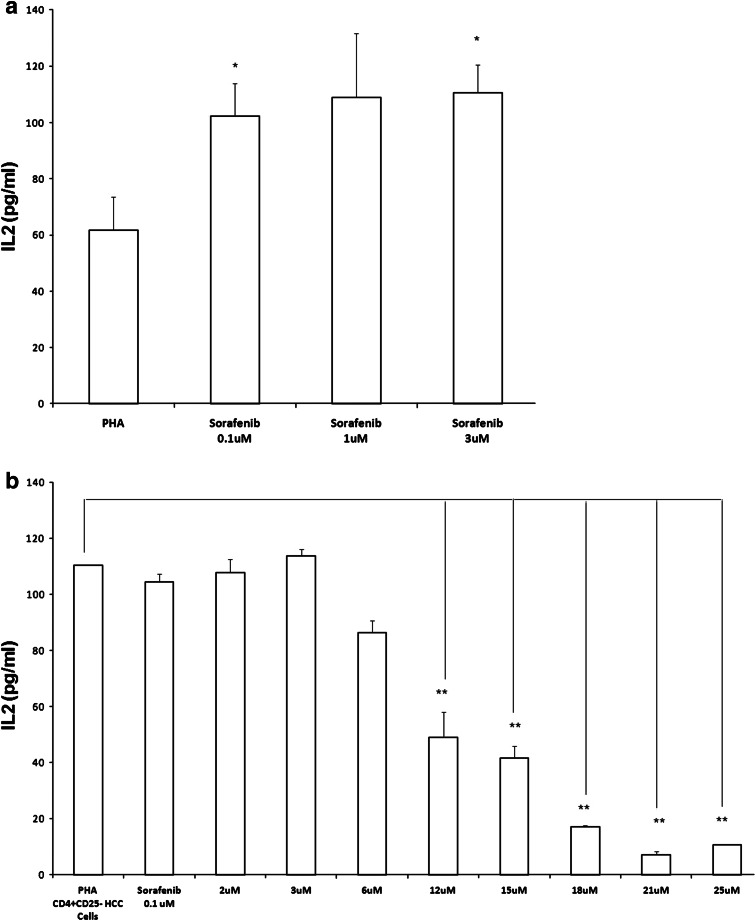
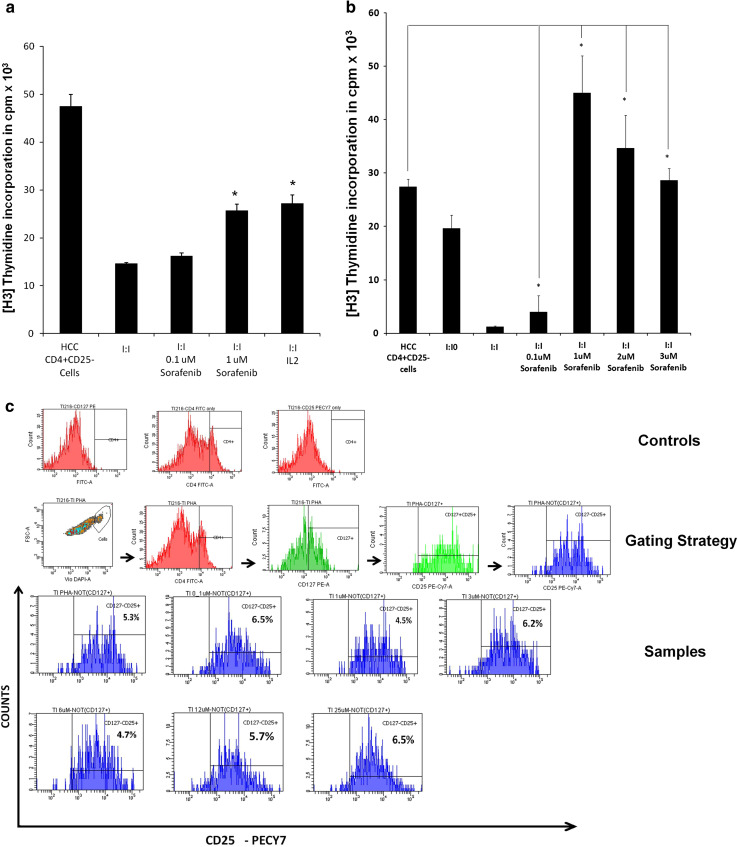
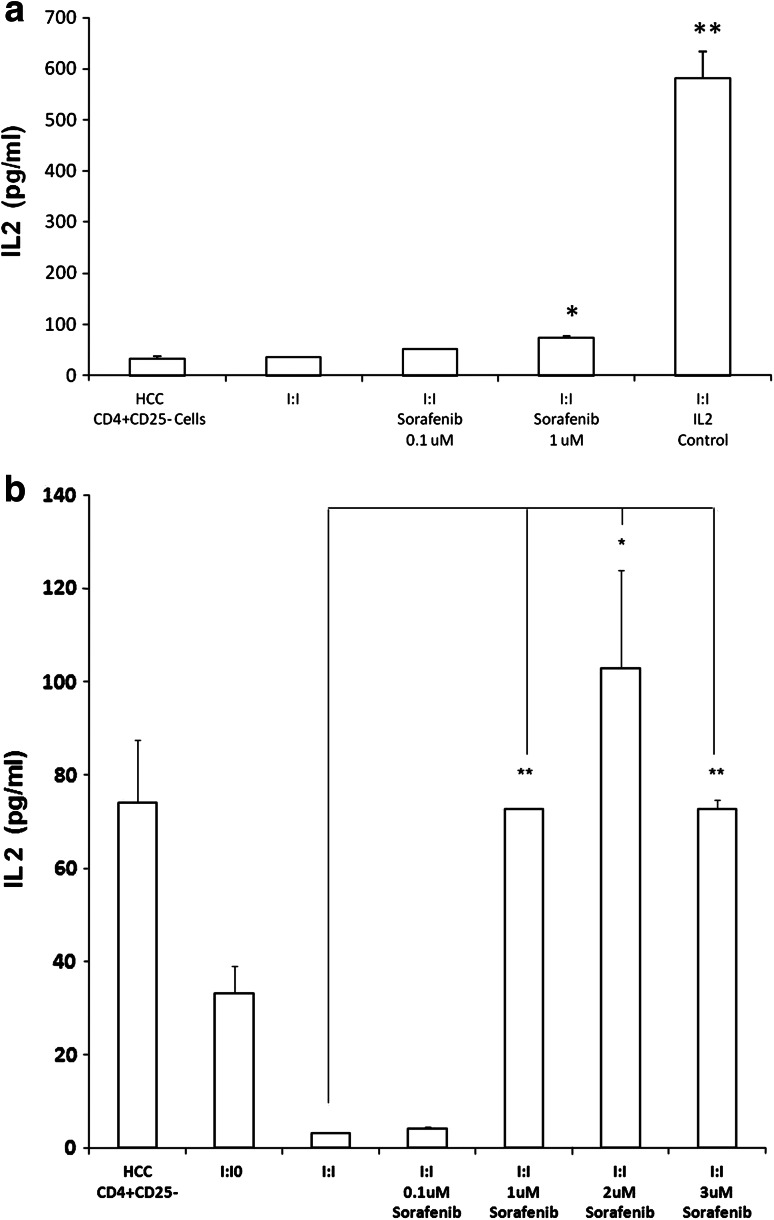
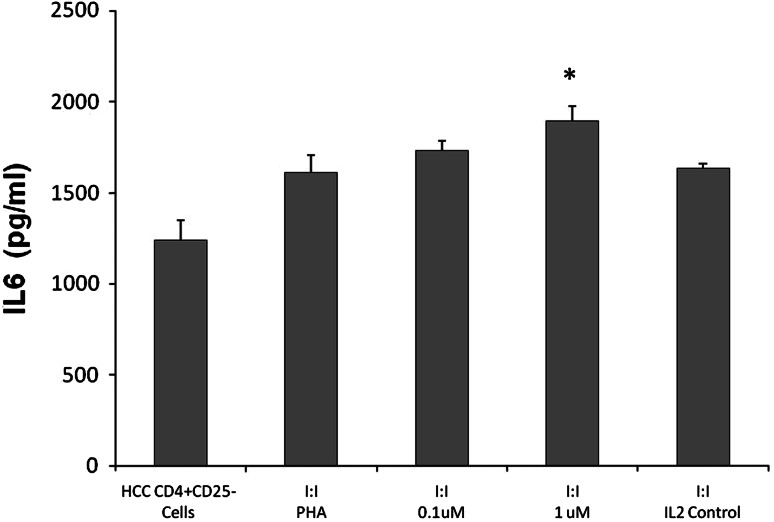
Hepatocellular carcinoma (HCC) is a difficult to treat cancer characterized by poor tumor immunity with only one approved systemic drug, sorafenib. If novel combination treatments are to be developed with immunological agents, the effects of sorafenib on tumor immunity are important to understand. In this study, we investigate the impact of sorafenib on the CD4+CD25- effector T cells (Teff) and CD4+CD25+ regulatory T cells (Tregs) from patients with HCC. We isolated Teff and Treg from peripheral mononuclear cells of HCC patients to determine immune reactivity by thymidine incorporation, ELISA and flow cytometry. Teff cultured alone or with Treg were supplemented with different concentrations of sorafenib. The effects of sorafenib on Teff responses were dose-dependent. Pharmacologic doses of sorafenib decreased Teff activation by down regulating CD25 surface expression. In contrast, sub-pharmacologic concentrations of sorafenib resulted in Teff activation. These low doses of sorafenib in the Teff cultures led to a significant increase in Teff proliferation, IL2 secretion and up-regulation of CD25 expression on the cell surface. In addition, low doses of sorafenib in the suppression Teff/Treg cocultures restored Teff responses by eliminating Treg suppression. The loss of Treg suppressive function correlated with an increase in IL2 and IL6 secretion. Our findings show that sub-pharmacologic doses of sorafenib impact subsets of T cells differently, selectively increasing Teff activation while blocking Treg function. In conclusion, this study describes novel immune activating properties of low doses of sorafenib by promoting immune responsiveness in patients with HCC.
Conflict of interest statement
Dr. Cabrera is a speaker, consultant, and has research grants from Bayer. Dr. Nelson is a consultant and has research grants from Bayer and Human Genome Science.
Figures


Similar articles
-
Influence of serum and soluble CD25 (sCD25) on regulatory and effector T-cell function in hepatocellular carcinoma.Scand J Immunol. 2010 Oct;72(4):293-301. doi: 10.1111/j.1365-3083.2010.02427.x. Scand J Immunol. 2010. PMID: 20883314 Free PMC article.
-
Sorafenib relieves cell-intrinsic and cell-extrinsic inhibitions of effector T cells in tumor microenvironment to augment antitumor immunity.Int J Cancer. 2014 Jan 15;134(2):319-31. doi: 10.1002/ijc.28362. Epub 2013 Jul 30. Int J Cancer. 2014. PMID: 23818246
-
Sorafenib reduces hepatic infiltrated regulatory T cells in hepatocellular carcinoma patients by suppressing TGF-beta signal.J Surg Oncol. 2013 Mar;107(4):422-7. doi: 10.1002/jso.23227. Epub 2012 Jul 25. J Surg Oncol. 2013. PMID: 22833259
-
[Regulatory T-cells and hepatocellular carcinoma: implication of the regulatory T lymphocytes in the control of the immune response].Bull Cancer. 2008 Dec;95(12):1219-25. doi: 10.1684/bdc.2008.0761. Bull Cancer. 2008. PMID: 19091657 Review. French.
-
The role of the adenosinergic pathway in immunosuppression mediated by human regulatory T cells (Treg).Curr Med Chem. 2011;18(34):5217-23. doi: 10.2174/092986711798184334. Curr Med Chem. 2011. PMID: 22087822 Free PMC article. Review.
Cited by
-
PD-1+ and Foxp3+ T cell reduction correlates with survival of HCC patients after sorafenib therapy.JCI Insight. 2016 Jul 21;1(11):e86182. doi: 10.1172/jci.insight.86182. JCI Insight. 2016. PMID: 27540594 Free PMC article.
-
Role of monocyte-to-lymphocyte ratio in predicting sorafenib response in patients with advanced hepatocellular carcinoma.Onco Targets Ther. 2018 Oct 10;11:6731-6740. doi: 10.2147/OTT.S173275. eCollection 2018. Onco Targets Ther. 2018. PMID: 30349306 Free PMC article.
-
Clinicopathological Aspects and Inflammation-Immune Markers in Alcohol and/or Hepatitis C Virus-Induced Hepatocellular Carcinoma Patients Treated With Sorafenib.Gastroenterology Res. 2024 Feb;17(1):23-31. doi: 10.14740/gr1689. Epub 2024 Feb 28. Gastroenterology Res. 2024. PMID: 38463146 Free PMC article.
-
Tyrosine Kinase Inhibitor Cabozantinib Inhibits Murine Renal Cancer by Activating Innate and Adaptive Immunity.Front Oncol. 2021 Apr 19;11:663517. doi: 10.3389/fonc.2021.663517. eCollection 2021. Front Oncol. 2021. PMID: 33954115 Free PMC article.
-
Targeting tumour microenvironment by tyrosine kinase inhibitor.Mol Cancer. 2018 Feb 19;17(1):43. doi: 10.1186/s12943-018-0800-6. Mol Cancer. 2018. PMID: 29455663 Free PMC article. Review.
References
-
- Cheng AL, Kang YK, Chen Z, Tsao CJ, Qin S, Kim JS, et al. Efficacy and safety of sorafenib in patients in the Asia-Pacific region with advanced hepatocellular carcinoma: a phase III randomised, double-blind, placebo-controlled trial. Lancet Oncol. 2009;1:25–34. doi: 10.1016/S1470-2045(08)70285-7. - DOI - PubMed
-
- Cao M, Cabrera R, Xu Y, Firpi R, Zhu H, Liu C, Nelson DR. Hepatocellular carcinoma cell supernatants increase expansion and function of CD4(+)CD25(+) regulatory T cells. Lab Invest. 2007;87:582–590. - PubMed
Publication types
MeSH terms
Substances
Grants and funding
LinkOut - more resources
Full Text Sources
Medical
Research Materials
