MicroRNA-30c targets cytoskeleton genes involved in breast cancer cell invasion
- PMID: 23224145
- PMCID: PMC3583223
- DOI: 10.1007/s10549-012-2346-4
MicroRNA-30c targets cytoskeleton genes involved in breast cancer cell invasion
Abstract
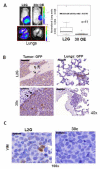
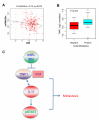
Metastasis remains a significant challenge in treating cancer. A better understanding of the molecular mechanisms underlying metastasis is needed to develop more effective treatments. Here, we show that human breast tumor biomarker miR-30c regulates invasion by targeting the cytoskeleton network genes encoding twinfilin 1 (TWF1) and vimentin (VIM). Both VIM and TWF1 have been shown to regulate epithelial-to-mesenchymal transition. Similar to TWF1, VIM also regulates F-actin formation, a key component of cellular transition to a more invasive mesenchymal phenotype. To further characterize the role of the TWF1 pathway in breast cancer, we found that IL-11 is an important target of TWF1 that regulates breast cancer cell invasion and STAT3 phosphorylation. The miR-30c-VIM/TWF1 signaling cascade is also associated with clinical outcome in breast cancer patients.
Figures


Similar articles
-
MicroRNA-30c inhibits pancreatic cancer cell proliferation by targeting twinfilin 1 and indicates a poor prognosis.World J Gastroenterol. 2019 Nov 14;25(42):6311-6321. doi: 10.3748/wjg.v25.i42.6311. World J Gastroenterol. 2019. PMID: 31754292 Free PMC article.
-
MicroRNA-30c inhibits human breast tumour chemotherapy resistance by regulating TWF1 and IL-11.Nat Commun. 2013;4:1393. doi: 10.1038/ncomms2393. Nat Commun. 2013. PMID: 23340433 Free PMC article.
-
miR-206 Inhibits Stemness and Metastasis of Breast Cancer by Targeting MKL1/IL11 Pathway.Clin Cancer Res. 2017 Feb 15;23(4):1091-1103. doi: 10.1158/1078-0432.CCR-16-0943. Epub 2016 Jul 19. Clin Cancer Res. 2017. PMID: 27435395 Free PMC article.
-
MicroRNA-30a inhibits cell migration and invasion by downregulating vimentin expression and is a potential prognostic marker in breast cancer.Breast Cancer Res Treat. 2012 Aug;134(3):1081-93. doi: 10.1007/s10549-012-2034-4. Epub 2012 Apr 4. Breast Cancer Res Treat. 2012. PMID: 22476851
-
MicroRNAs regulate the epithelial-mesenchymal transition and influence breast cancer invasion and metastasis.Tumour Biol. 2017 Feb;39(2):1010428317691682. doi: 10.1177/1010428317691682. Tumour Biol. 2017. PMID: 28222665 Review.
Cited by
-
14q32-encoded microRNAs mediate an oligometastatic phenotype.Oncotarget. 2015 Feb 28;6(6):3540-52. doi: 10.18632/oncotarget.2920. Oncotarget. 2015. PMID: 25686838 Free PMC article.
-
MicroRNA-30c inhibits pancreatic cancer cell proliferation by targeting twinfilin 1 and indicates a poor prognosis.World J Gastroenterol. 2019 Nov 14;25(42):6311-6321. doi: 10.3748/wjg.v25.i42.6311. World J Gastroenterol. 2019. PMID: 31754292 Free PMC article.
-
Breast Cancer in Very Young Patients in a Spanish Cohort: Age as an Independent Bad Prognostic Indicator.Breast Cancer (Auckl). 2019 Feb 20;13:1178223419828766. doi: 10.1177/1178223419828766. eCollection 2019. Breast Cancer (Auckl). 2019. PMID: 30814839 Free PMC article.
-
An integrated analysis of the SOX2 microRNA response program in human pluripotent and nullipotent stem cell lines.BMC Genomics. 2014 Aug 25;15:711. doi: 10.1186/1471-2164-15-711. BMC Genomics. 2014. PMID: 25156079 Free PMC article.
-
Rab14 Suppression Mediated by MiR-320a Inhibits Cell Proliferation, Migration and Invasion in Breast Cancer.J Cancer. 2016 Nov 25;7(15):2317-2326. doi: 10.7150/jca.15737. eCollection 2016. J Cancer. 2016. PMID: 27994670 Free PMC article.
References
-
- Sporn MB. The war on cancer. Lancet. 1996;347(9012):1377–1381. - PubMed
-
- Prat A, Perou CM. Mammary development meets cancer genomics. Nat Med. 2009;15(8):842–844. doi:nm0809-842 [pii] 10.1038/nm0809-842. - PubMed
-
- Lim E, Vaillant F, Wu D, Forrest NC, Pal B, Hart AH, Asselin-Labat ML, Gyorki DE, Ward T, Partanen A, Feleppa F, Huschtscha LI, Thorne HJ, Fox SB, Yan M, French JD, Brown MA, Smyth GK, Visvader JE, Lindeman GJ. Aberrant luminal progenitors as the candidate target population for basal tumor development in BRCA1 mutation carriers. Nat Med. 2009;15(8):907–913. doi:nm.2000 [pii] 10.1038/nm.2000. - PubMed
Publication types
MeSH terms
Substances
Grants and funding
- P01 DK053074/DK/NIDDK NIH HHS/United States
- P30 CA014599/CA/NCI NIH HHS/United States
- K99CA160638-01A1/CA/NCI NIH HHS/United States
- CA 014599/CA/NCI NIH HHS/United States
- DK070103-05/DK/NIDDK NIH HHS/United States
- R21 CA159066/CA/NCI NIH HHS/United States
- P01 CA139490/CA/NCI NIH HHS/United States
- P50CA125183-05/CA/NCI NIH HHS/United States
- K12 CA139160/CA/NCI NIH HHS/United States
- P50 CA125183/CA/NCI NIH HHS/United States
- 1K12CA139160-02/CA/NCI NIH HHS/United States
- UL1 RR024999/RR/NCRR NIH HHS/United States
- K99 CA160638/CA/NCI NIH HHS/United States
- U54 CA126524/CA/NCI NIH HHS/United States
- T90 DK070103/DK/NIDDK NIH HHS/United States
- P50 CA058223/CA/NCI NIH HHS/United States
- U54 CA 126524/CA/NCI NIH HHS/United States
- 5-P50-CA58223-17/CA/NCI NIH HHS/United States
- R00 CA160638/CA/NCI NIH HHS/United States
LinkOut - more resources
Full Text Sources
Other Literature Sources
Medical
Research Materials
Miscellaneous

