. 2012 Dec;27(12):903-9.
doi: 10.1007/s10654-012-9752-0. Epub 2012 Dec 7.

A proposal for an additional clinical trial outcome measure assessing preventive effect as delay of events

Affiliations

A proposal for an additional clinical trial outcome measure assessing preventive effect as delay of events

Per Lytsy et al. Eur J Epidemiol. 2012 Dec.

Abstract

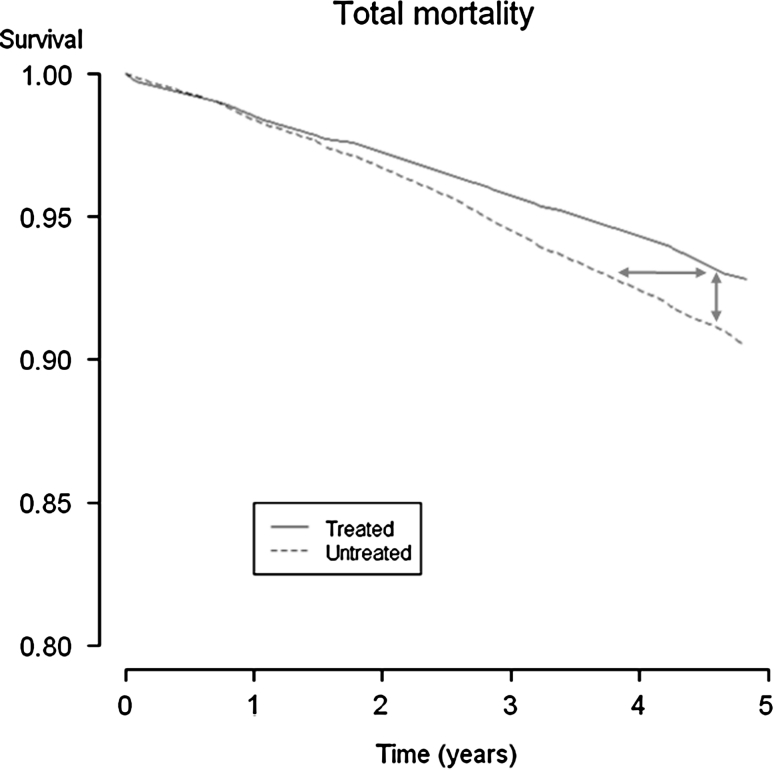
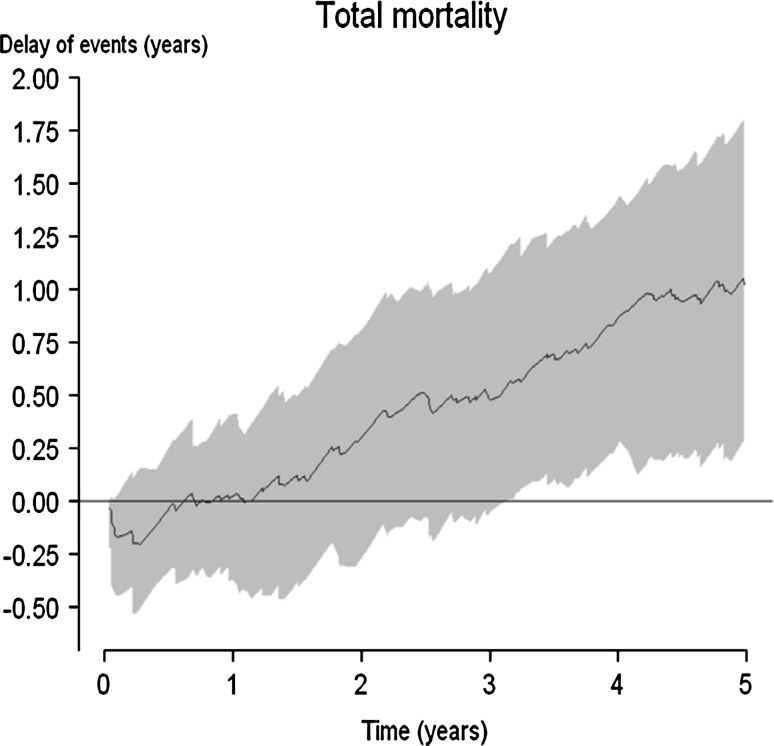
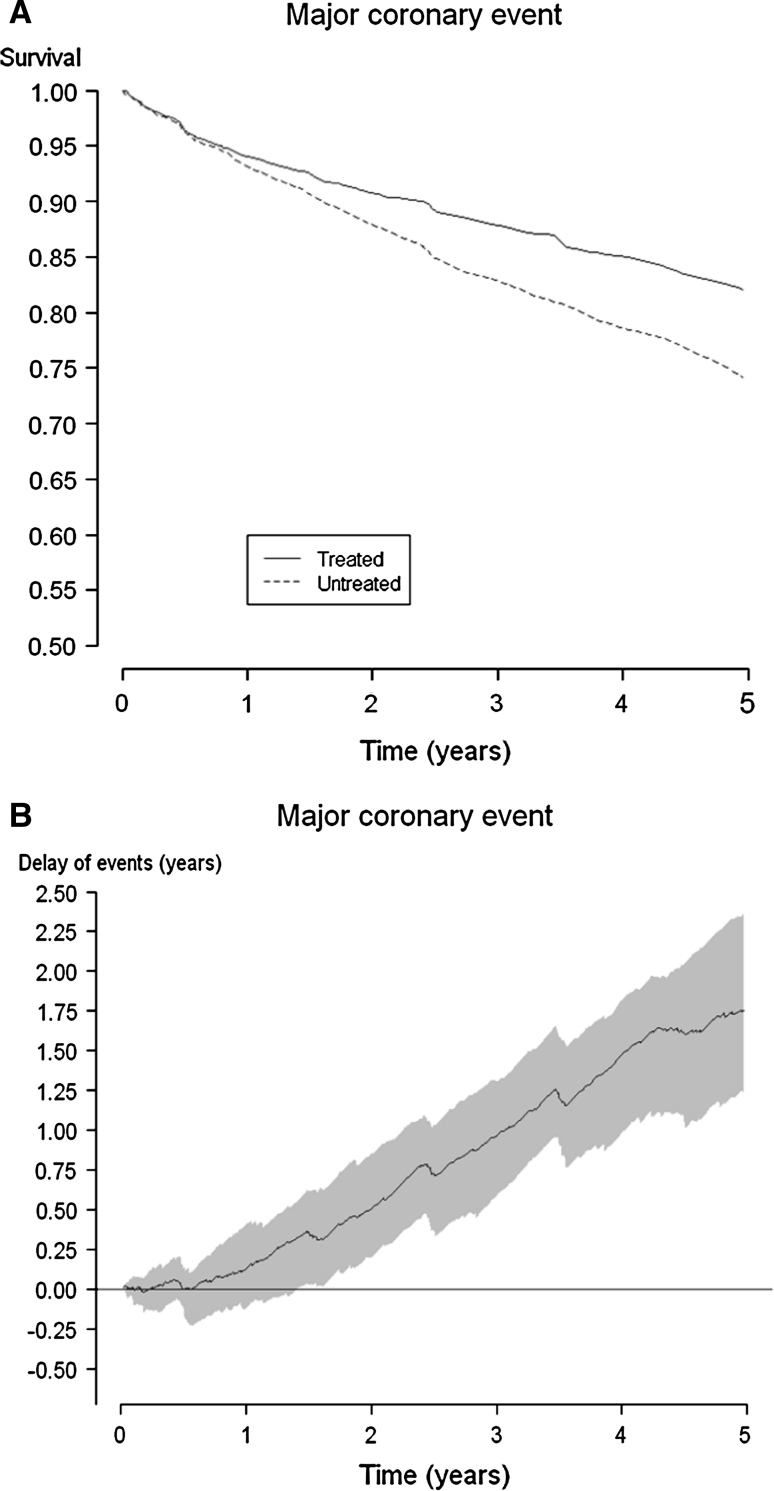
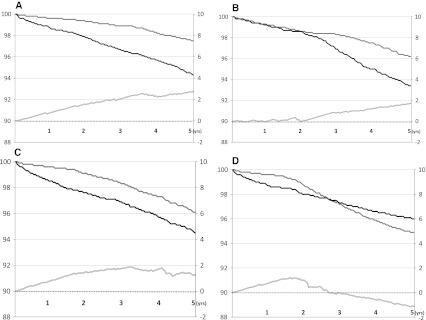
Many effect measures used in clinical trials are problematic because they are differentially understood by patients and physicians. The emergence of novel methods such as accelerated failure-time models and quantile regression has shifted the focus of effect measurement from probability measures to time-to-event measures. Such modeling techniques are rapidly evolving, but matching non-parametric descriptive measures are lacking. We propose such a measure, the delay of events, demonstrating treatment effect as a gain in event-free time. We believe this measure to be of value for shared clinical decision-making. The rationale behind the measure is given, and it is conceptually explained using the Kaplan-Meier estimate and the quantile regression framework. A formula for calculation of the delay of events is given. Hypothetical and empirical examples are used to demonstrate the measure. The measure is discussed in relation to other measures highlighting the time effects of preventive treatments. There is a need to further investigate the properties of the measure as well as its role in clinical decision-making.


Figures

Fig. 1
Fig. 1
Kaplan–Meier curves for all-cause mortality from the 4S study. The vertical difference between the curves represents a difference in proportions, at different time points. The horizontal difference between the curves represents a time difference when the cumulative incidence is equal, which corresponds to the time an event is delayed
Fig. 2
Fig. 2
The delay of event curve (with shadowed 95 % confidence intervals) for the endpoint total mortality in the 4S study
Fig. 3
Fig. 3
Kaplan-Meier curves for major coronary events* in the 4S study (a) and the consecutive delay of event curve with shadowed 95 % confidence interval (b). *Major coronary events comprised coronary deaths, definite or probable hospital-verified non-fatal acute MI, resuscitated cardiac arrest, and definite silent MI verified by electrocardiogram
Fig. 4
Fig. 4
a Kaplan Meier curves of four hypothetical intervention studies and their subsequent delay of event curves. Y-axes on the left correspond to the proportion of event free subjects in the compared groups; Y-axes on the right represent the time units used in each study. Diverging survival curves will present an increasing delay of events curve within the study time period. b Survival curves that are diverging after an initial latency period will present a delay of events curve where the effect is delayed; in this case the effect becomes apparent after about 2 years. c Survival curves diverging initially followed by parallel development over time will present a delay of event curve demonstrating a sustained effect, which in this case after 2 years of treatment approximates from between 1 and 2 years until the end of follow-up. d Survival curves diverging and crossing over during the study period will demonstrate a delay of events curve where the positive effect seen first diminishes and then provides a negative effect. A negative delay of events curve should be interpreted as if the active treatment causes harm, as demonstrated by a higher event rate in the treated group

Similar articles

Cited by

References

    1. Hux JE, Naylor CD. Communicating the benefits of chronic preventive therapy: does the format of efficacy data determine patients’ acceptance of treatment? Med Decis Mak. 1995;15(2):152–157. doi: 10.1177/0272989X9501500208. - DOI - PubMed
    1. Malenka DJ, Baron JA, Johansen S, Wahrenberger JW, Ross JM. The framing effect of relative and absolute risk. J Gen Intern Med. 1993;8(10):543–548. doi: 10.1007/BF02599636. - DOI - PubMed
    1. Forrow L, Taylor WC, Arnold RM. Absolutely relative: how research results are summarized can affect treatment decisions. Am J Med. 1992;92(2):121–124. doi: 10.1016/0002-9343(92)90100-P. - DOI - PubMed
    1. Bobbio M, Demichelis B, Giustetto G. Completeness of reporting trial results: effect on physicians’ willingness to prescribe. Lancet. 1994;343(8907):1209–1211. doi: 10.1016/S0140-6736(94)92407-4. - DOI - PubMed
    1. Nexoe J, Gyrd-Hansen D, Kragstrup J, Kristiansen IS, Nielsen JB. Danish GPs’ perception of disease risk and benefit of prevention. Fam Pract. 2002;19(1):3–6. doi: 10.1093/fampra/19.1.3. - DOI - PubMed

LinkOut - more resources