. 2012 Dec 7;338(6112):1344-8.
doi: 10.1126/science.1226683.

Identity and function of a large gene network underlying mutagenic repair of DNA breaks

Affiliations

Identity and function of a large gene network underlying mutagenic repair of DNA breaks

Abu Amar M Al Mamun et al. Science. .

Abstract

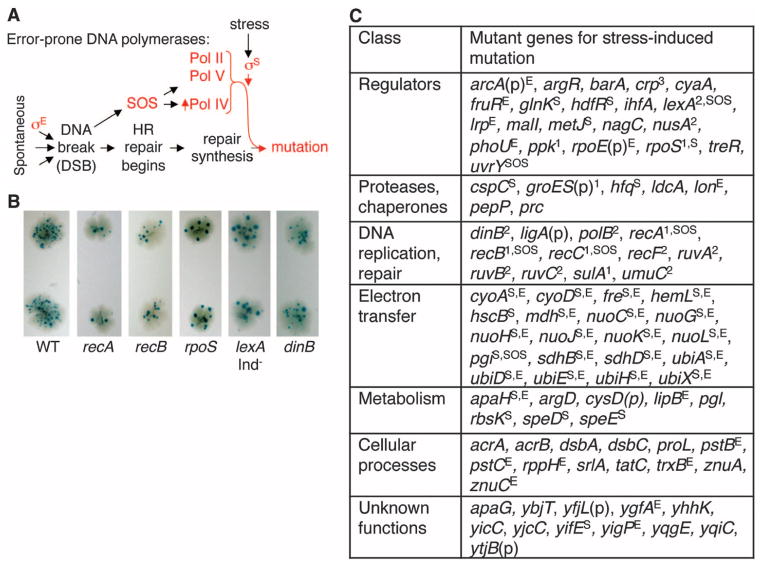
Mechanisms of DNA repair and mutagenesis are defined on the basis of relatively few proteins acting on DNA, yet the identities and functions of all proteins required are unknown. Here, we identify the network that underlies mutagenic repair of DNA breaks in stressed Escherichia coli and define functions for much of it. Using a comprehensive screen, we identified a network of ≥93 genes that function in mutation. Most operate upstream of activation of three required stress responses (RpoS, RpoE, and SOS, key network hubs), apparently sensing stress. The results reveal how a network integrates mutagenic repair into the biology of the cell, show specific pathways of environmental sensing, demonstrate the centrality of stress responses, and imply that these responses are attractive as potential drug targets for blocking the evolution of pathogens.


Figures

Fig. 1
Fig. 1
(A) Roles of stress responses in mutagenic repair of DNA DSBs by homologous recombination (HR) [reviewed, (7)]. (B) Primary screen for DSB-dependent SIM-deficient mutants. Blue papillae in the white colonies are Lac+ mutant clones formed after prolonged starvation stress (8). (C) Identities of 93 SIM-network genes and results of secondary screens. 1Previously known, found in this screen. 2Previously known, not found in this screen. 3Identified on the basis of genes discovered in this screen. (p), transposon inserted in the promoter (table S12). Superscripts S, E, and SOS indicate decreased σS activity, σE activity, and spontaneous SOS induction, respectively (table S7).
Fig. 2
Fig. 2
(A to F) Validation of mutants in chromosomal Tet frameshift and Nal base substitution SIM assays. *Significantly SIM-deficient (P values in table S5, two-tailed Student’s t test). Relative mutant frequencies, mutant frequency divided by that of the WT-DSB (I-Sce I–positive) controls assayed in parallel. Means ± SEM (n ≥3 experiments each), for this and all figures.
Fig. 3
Fig. 3
The stress-induced mutation network. (A) Protein-protein interactions: CytoScape 2.8.3 software, “unweighted force-directed layout” (28), links from STRING 9.0 (12). Proteins that promote σS, σE, and SOS activation (Fig. 4), as green, black circle, and red circle, constitute 54% of the network. Downstream of SOS (7), solid red. (B) Coexpression and protein-protein interaction are significantly more clustered than random controls. Gene expression data (13). The 93 SIM genes, (92 × 93)/2 = 4278 pairs, show correlation coefficient distributions (top): bars, entire range; boxes 25th and 75th percentile; red bars, mean. Of 4278 pairs, 3350 show positive correlation coefficient; 928 lie below the zero threshold level. High statistical significance for the strong phenotype (S) genes is increased by addition of moderate (M) and weak (W) (table S3). (Bottom) Significantly more protein-protein interactions for SIM than random genes. Of 4278 pairs, 1320 show positive interaction scores; 2958 pairs do not. P values: sign test of the probability of failure to reject the null hypothesis “number of positively correlated pairs is the same as in the random control.” (C) Allocation of network genes upstream of stress responses (data summarized in tables S1 and S7).
Fig. 4
Fig. 4
Identification of upstream activators of the σS, σE, and SOS stress responses. Results summarized in table S1. (A) Sample of ETC mutants showing decreased σS activity. See table S8 and fig. S4 for 26 others. (B) No change in transcription from the lac promoter. (C) Mutants enter stationary phase normally (also fig. S5). (D to F) ETC mutants are partially suppressed by up-regulation of σS via deletion of (D) arcB, (E) arcA, or (F) rssB (table S9 and fig. S7). Ratio of mutation rate (bars) and percent mutation restored relative to wild type (WT). (G to I) ΔrpoS is epistatic to ETC mutations in SIM. Double-mutant analyses without (G) or with (H and I) I-Sce I–induced DSBs, showing action in the same pathway. (J) Sample of SIM genes upstream of σE activity [β-galactosidase (β-gal) expression from a σE-regulated promoter, fig. S9, and table S11 for the rest]. (K) Spontaneous SOS induction (21) is reduced in recB, recC, pgi, and uvrY mutants (P = 0.00013, 0.017, 0.0013, and 0.00011, two-tailed Student’s t test). (L) Model: ETC-mediated stress-sensing from starvation to mutation. Described in supplementary text S4. Products of genes identified in screens are in red.

References

    1. Ponder RG, Fonville NC, Rosenberg SM. Mol Cell. 2005;19:791. - PubMed
    1. Shee C, Gibson JL, Darrow MC, Gonzalez C, Rosenberg SM. Proc Natl Acad Sci USA. 2011;108:13659. - PMC - PubMed
    1. Galhardo RS, Hastings PJ, Rosenberg SM. Crit Rev Biochem Mol Biol. 2007;42:399. - PMC - PubMed
    1. Mittelman D, Wilson JH. Cell Stress Chaperones. 2010;15:463. - PMC - PubMed
    1. Bindra RS, Crosby ME, Glazer PM. Cancer Metastasis Rev. 2007;26:249. - PubMed

Publication types

MeSH terms

Substances

LinkOut - more resources