. 2013 Mar;56(3):608-17.
doi: 10.1007/s00125-012-2787-7. Epub 2012 Dec 8.

AMP-activated protein kinase (AMPK)α2 plays a role in determining the cellular fate of glucose in insulin-resistant mouse skeletal muscle

Affiliations

AMP-activated protein kinase (AMPK)α2 plays a role in determining the cellular fate of glucose in insulin-resistant mouse skeletal muscle

R S Lee-Young et al. Diabetologia. 2013 Mar.

Abstract

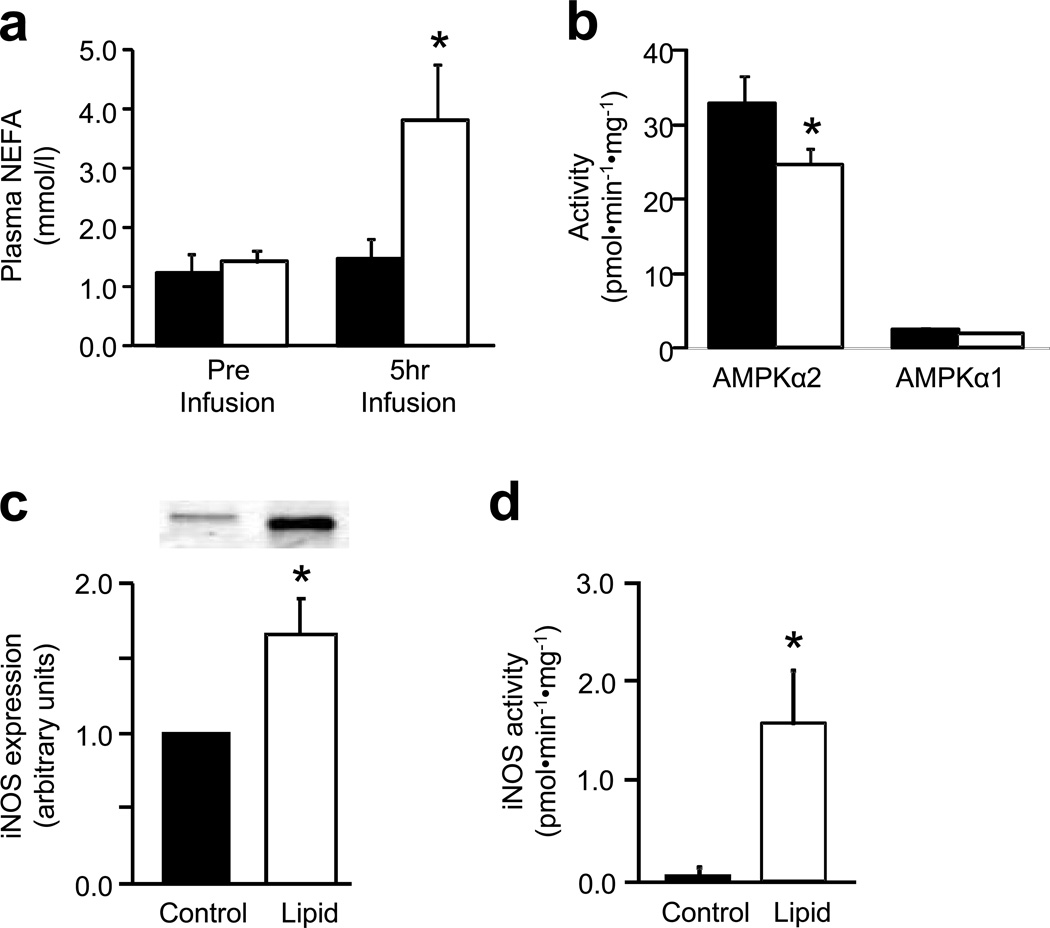
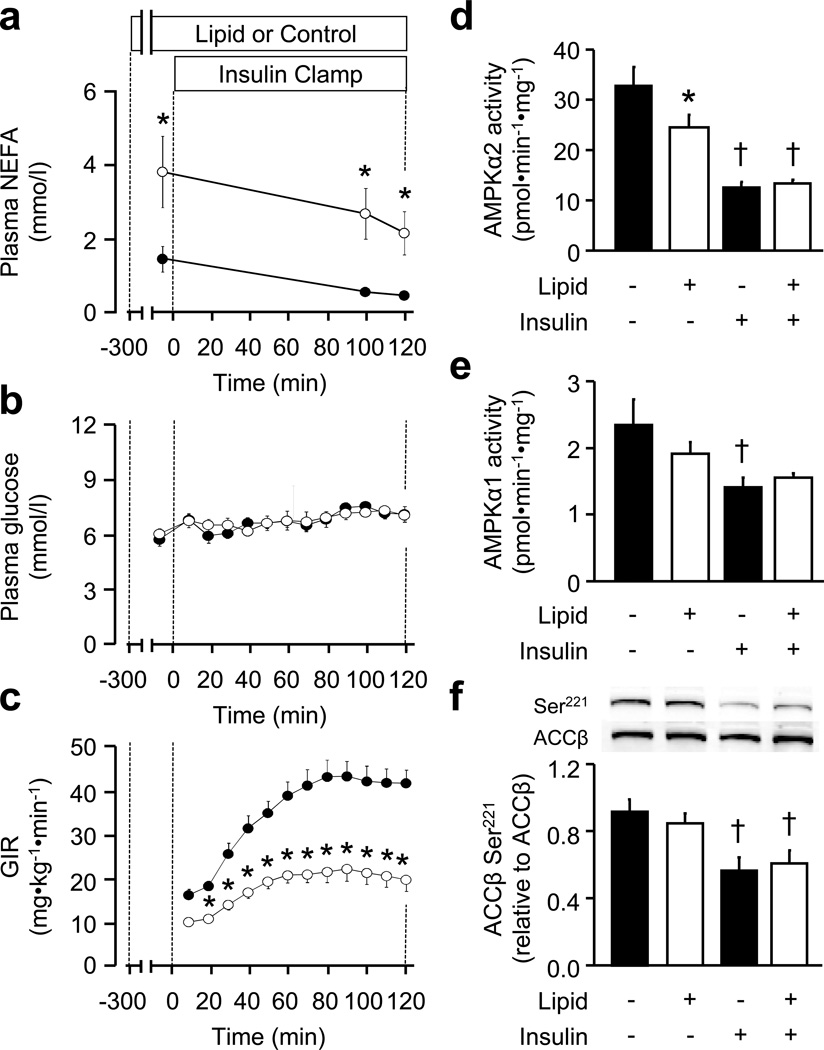
Aims/hypothesis: We determined whether: (1) an acute lipid infusion impairs skeletal muscle AMP-activated protein kinase (AMPK)α2 activity, increases inducible nitric oxide synthase (iNOS) and causes peripheral insulin resistance in conscious, unstressed, lean mice; and (2) restoration of AMPKα2 activity during the lipid infusion attenuates the increase in iNOS and reverses the defect in insulin sensitivity in vivo.

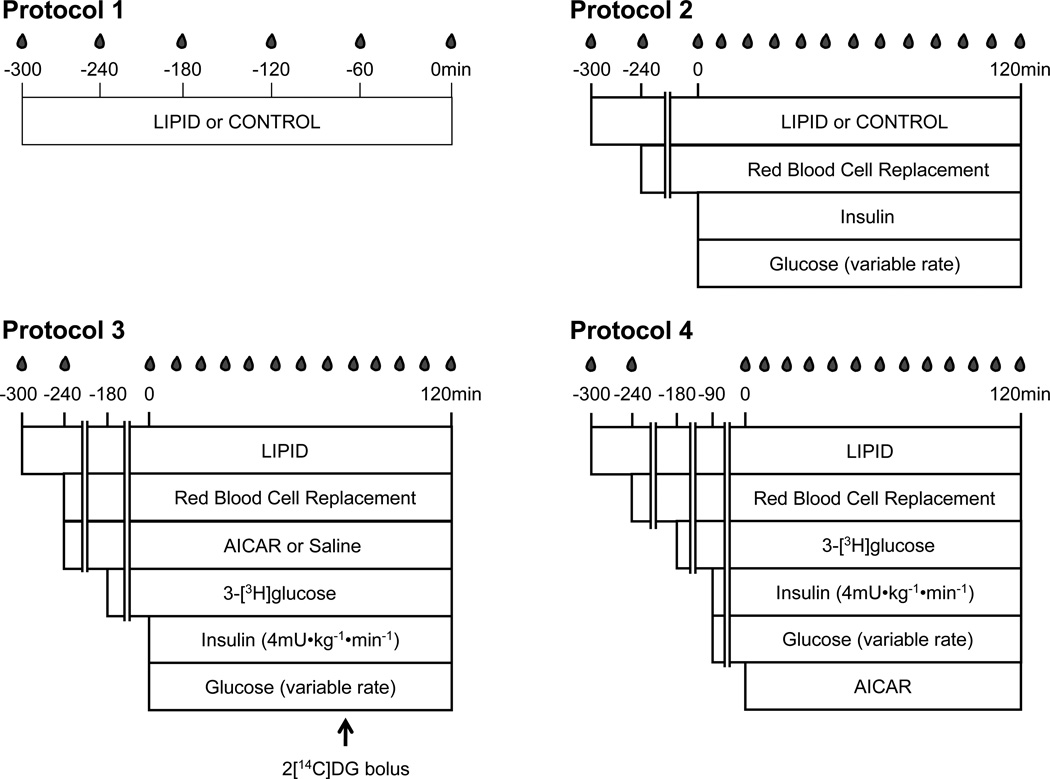
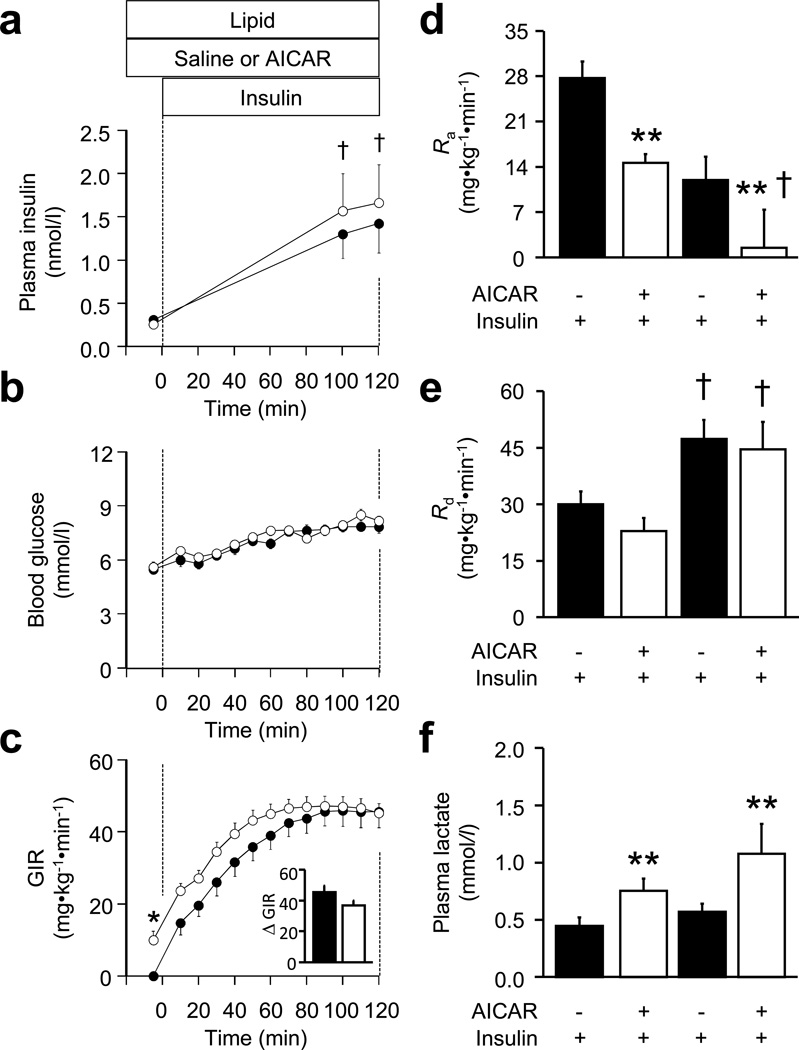
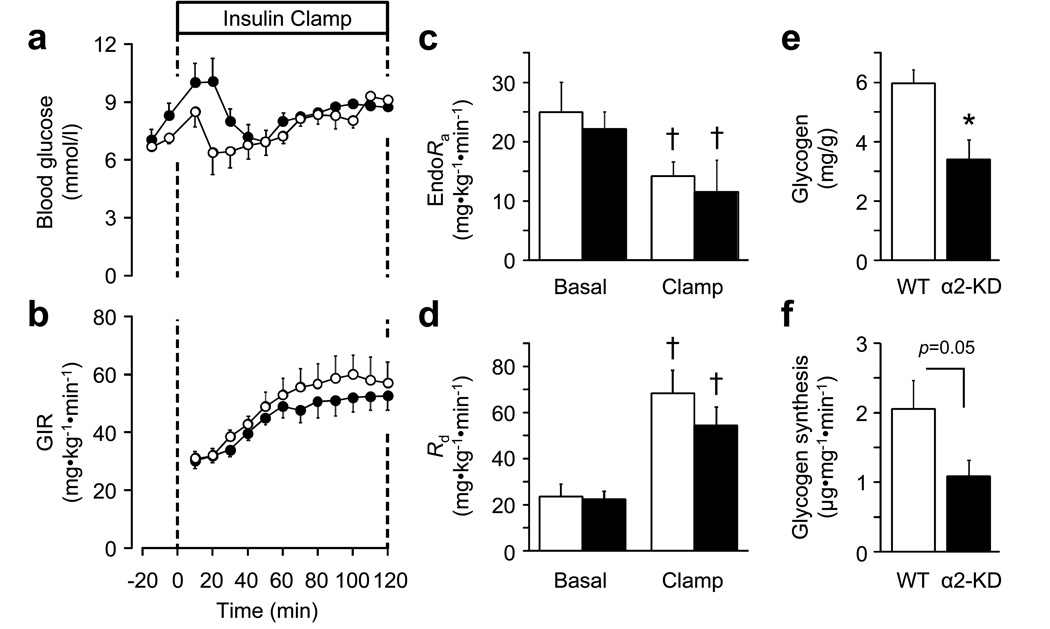
Methods: Chow-fed, 18-week-old C57BL/6J male mice were surgically catheterised. After 5 days they received: (1) a 5 h infusion of 5 ml kg(-1) h(-1) Intralipid + 6 U/h heparin (Lipid treatment) or saline (Control); (2) Lipid treatment or Control, followed by a 2 h hyperinsulinaemic-euglycaemic clamp (insulin clamp; 4 mU kg(-1) min(-1)); and (3) infusion of the AMPK activator, 5-aminoimidazole-4-carboxamide 1-β-D-ribofuranoside (AICAR) (1 mg kg(-1) min(-1)), or saline during Lipid treatment, followed by a 2 h insulin clamp. In a separate protocol, mice producing a muscle-specific kinase-dead AMPKα2 subunit (α2-KD) underwent an insulin clamp to determine the role of AMPKα2 in insulin-mediated muscle glucose metabolism.

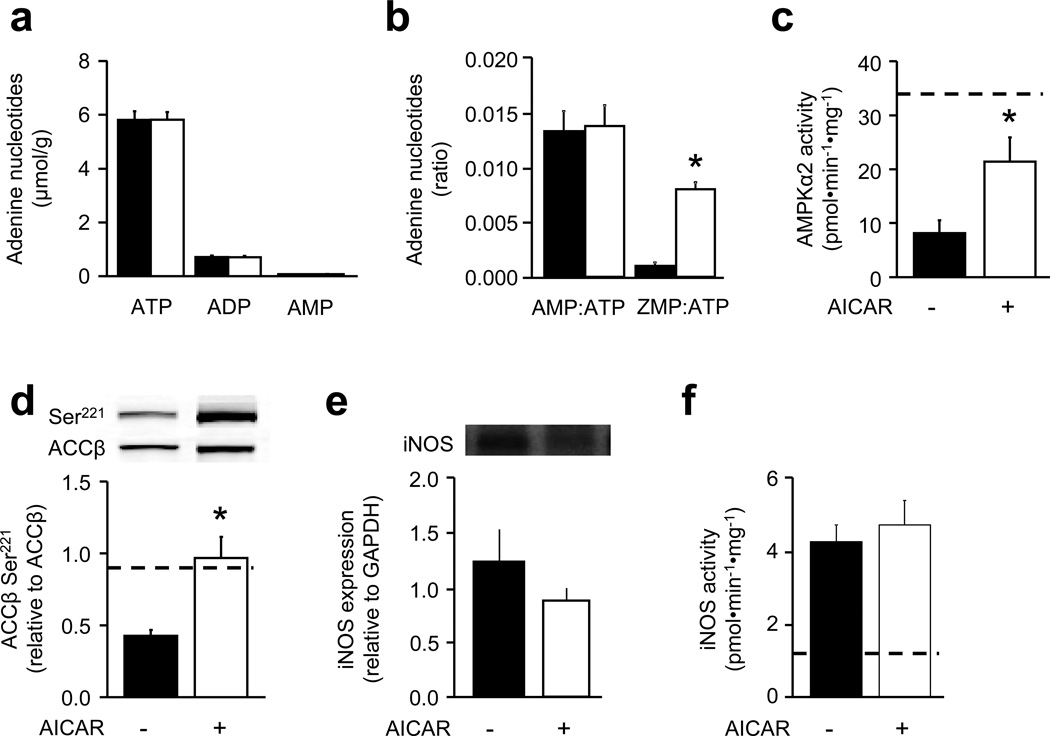
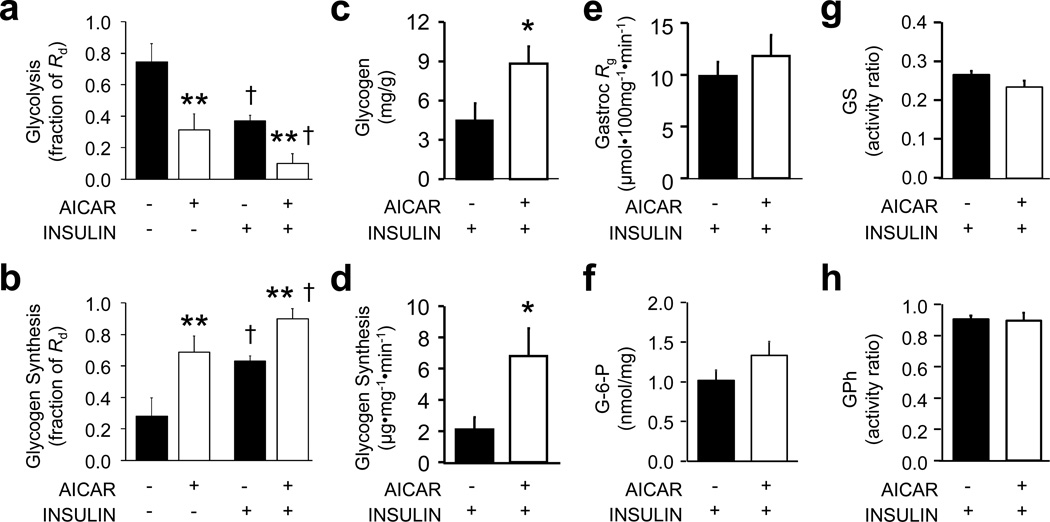
Results: Lipid treatment decreased AMPKα2 activity, increased iNOS abundance/activation and reduced whole-body insulin sensitivity in vivo. AICAR increased AMPKα2 activity twofold; this did not suppress iNOS or improve whole-body or tissue-specific rates of glucose uptake during Lipid treatment. AICAR caused a marked increase in insulin-mediated glycogen synthesis in skeletal muscle. Consistent with this latter result, lean α2-KD mice exhibited impaired insulin-stimulated glycogen synthesis even though muscle glucose uptake was not affected.

Conclusions/interpretation: Acute induction of insulin resistance via lipid infusion in healthy mice impairs AMPKα2, increases iNOS and causes insulin resistance in vivo. However, these changes do not appear to be interrelated. Rather, a functionally active AMPKα2 subunit is required for insulin-stimulated muscle glycogen synthesis.


Figures

Figure 1
Figure 1
Schematic outlines of the four different infusion protocols used in C57BL/6J wild-type mice, i.e. (a) Protocol 1, (b) Protocol 2, (c) Protocol 3 and (d) Protocol 4. Arrow (c), bolus administration of 2-[14C]DG at 78 min
Figure 2
Figure 2
Effect of a 5 h infusion of 5 ml kg−1 h−1 Intralipid + 6 U/h heparin (Lipid treatment) or of an equivalent volume of saline (Control) on (a) plasma NEFA levels, (b) gastrocnemius AMPKα2 and -α1 activity, (c) iNOS abundance (as fold change vs control) and (d) iNOS activity. Data are mean±SEM for n=5 per group; *p<0.05 vs corresponding control value
Figure 3
Figure 3
(a) Plasma NEFA levels, (b) arterial glucose levels and (c) GIR prior to (−300 to 0 min) and during (0 to 120 min) a 2 h hyperinsulinaemic–euglycaemic clamp as described in the Methods, in mice that received 5 ml kg−1 h−1 Intralipid + 6 U/h heparin from −300 to 120 min. White circles, Lipid treatment; black circles, Control. (d) Gastrocnemius AMPKα2 activity, (e) AMPKα1 activity and (f) ACCβ Ser221 phosphorylation. Data are mean±SEM for n=5–9 per group; *p<0.05 vs corresponding Control value; p<0.05 vs corresponding non-insulin value
Figure 4
Figure 4
AICAR (1 mg kg−1 min−1) (white bars) or an equivalent volume of saline (black bars) was infused during the last 4 h of a 5 h lipid infusion (5 ml kg−1 h−1 Intralipid + 6 U/h heparin) and a subsequent 2 h insulin clamp. (a, b) Gastrocnemius adenine nucleotide levels, (c) AMPKα2 activity, (d) ACCβ Ser221 phosphorylation (relative to ACCβ), (e) iNOS abundance (relative to GAPDH) and (f) iNOS activity were determined. Dashed line (c, d, f), values in mice following 5 h of Lipid treatment or Control (i.e. in the absence of insulin). Data are mean±SEM for n=11–12 (a, b) and n=5–7 (c–f); *p<0.05 vs corresponding saline value
Figure 5
Figure 5
Plasma insulin levels (a), blood glucose levels (b) and GIR, with insulin-induced change in GIR (ΔGIR) (c) during a 2 h insulin clamp, which was preceded by a 5 h lipid infusion (5 ml kg−1 h−1 Intralipid + 6 U/h heparin) in conjunction with AICAR (1 mg kg−1 min−1) (white circles) or an equivalent volume of saline (black circles), which was infused during the last 4 h of the lipid infusion. The lipid and AICAR or saline infusions were continued throughout the clamp. (d) The effect of the above treatment on EndoRa, (e) Rd and (f) plasma lactate levels. Data are mean±SEM for n=11–12; *p<0.05 for main effect, AICAR; p<0.05 for main effect, insulin
Figure 6
Figure 6
The effect of a 4 h AICAR infusion (1 mg kg−1 min−1) or an equivalent volume of saline, followed by a 2 h insulin clamp on (a) whole-body rates of glycolysis and (b) glycogen synthesis, expressed as a fraction of whole-body Rd. Lipid treatment at 5 ml kg−1 h−1 Intralipid + 6 U/h heparin was administered throughout. (c) Also shown are gastrocnemius glycogen content, (d) [3-3H]glucose incorporation into glycogen, (e) the glucose metabolic index (Rg), (f) glucose-6-phosphate (G-6-P) levels, (g) GS activity and (h) glycogen phosphorylase (GPh) activity under the above conditions. Data are mean±SEM for n=6 per group; *p<0.05 for main effect, AICAR; p<0.05 for main effect, insulin; p<0.05 vs corresponding saline value
Figure 7
Figure 7
Blood glucose (a), GIR (b), EndoRa (c) and Rd (d) before (Basal) and in response to an insulin clamp (0 to 120 min) in wild-type (WT) mice (white circles/bars) and mice producing α2-KD in skeletal muscle (black circles/bars). (e) Glycogen levels following the insulin clamp and (f) glycogen synthesis during the insulin clamp. Data are mean±SEM for n=5–6; *p<0.05 vs corresponding WT value; p<0.05 vs Basal; p=0.05

References

    1. de Lange P, Moreno M, Silvestri E, Lombardi A, Goglia F, Lanni A. Fuel economy in food-deprived skeletal muscle: signaling pathways and regulatory mechanisms. FASEB J. 2007;21:3431–3441. - PubMed
    1. Seufert J. A fixed-dose combination of pioglitazone and metformin: A promising alternative in metabolic control. Curr Med Res Opin. 2006;22(Suppl 2):S39–S48. - PubMed
    1. Hardie DG. AMP-activated/SNF1 protein kinases: conserved guardians of cellular energy. Nat Rev Mol Cell Biol. 2007;8:774–785. - PubMed
    1. Logie L, Harthill J, Patel K, et al. Cellular responses to the metal-binding properties of metformin. Diabetes. 2012;61:1423–1433. - PMC - PubMed
    1. Iglesias MA, Ye JM, Frangioudakis G, et al. AICAR administration causes an apparent enhancement of muscle and liver insulin action in insulin-resistant high-fat-fed rats. Diabetes. 2002;51:2886–2894. - PubMed

Publication types