

Characterization of multiple bistratified retinal ganglion cells in a purkinje cell protein 2-Cre transgenic mouse line
- PMID: 23224947
- PMCID: PMC3619020
- DOI: 10.1002/cne.23279
Characterization of multiple bistratified retinal ganglion cells in a purkinje cell protein 2-Cre transgenic mouse line
Abstract
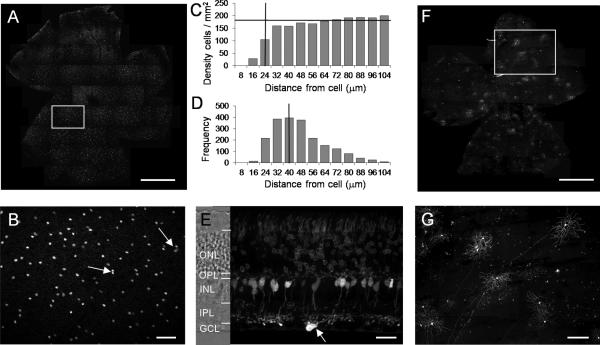
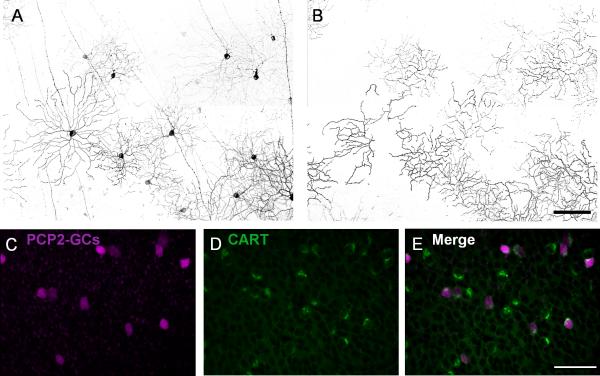
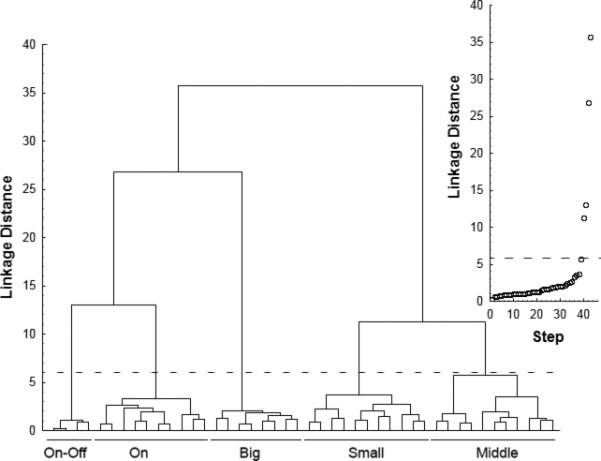
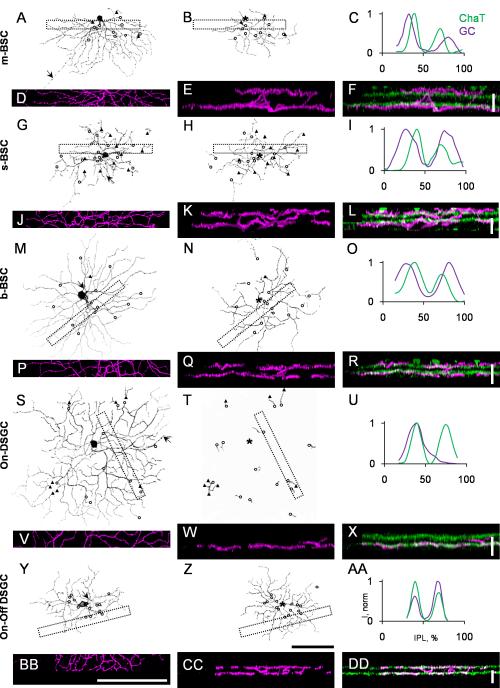
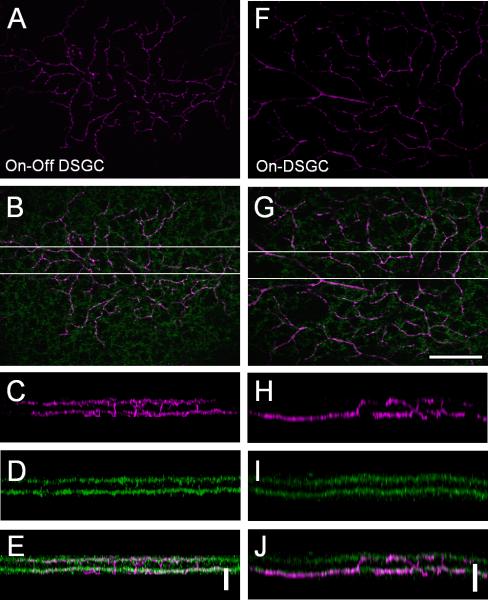
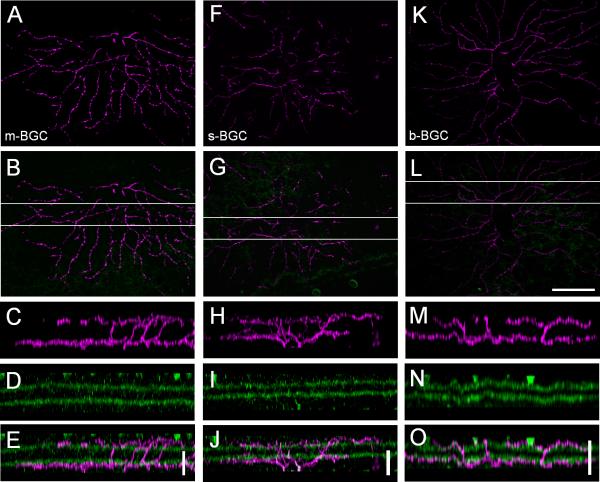
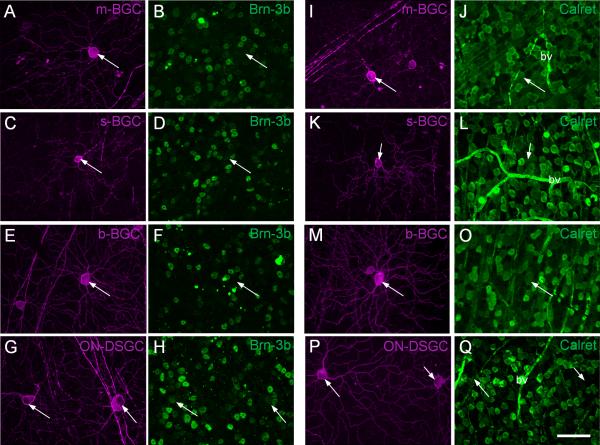
Retinal ganglion cells are categorized into multiple classes, including multiple types of bistratified ganglion cells (BGCs). The recent use of transgenic mouse lines with specific type(s) of ganglion cells that are labeled by fluorescent markers has facilitated the morphological and physiological studies of BGCs, particularly the directional-selective BGCs. The most important benefit from using transgenic animals is the capability to perform in vivo gene manipulation. In particular, the Cre/LoxP recombination system has become a powerful tool, allowing gene deletion, overexpression, and ectopic expression in a cell type-specific and temporally controlled fashion. The key to this tool is the availability of Cre mouse lines with cell or tissue type-specific expression of Cre recombinase. In this study we characterized the Cre-positive retinal ganglion cells in a PCP2 (Purkinje cell protein 2)-cre mouse line. We found that all of the Cre-positive retinal ganglion cells were BGCs. Based on morphological criteria, we determined that they can be grouped into five types. The On- and Off-dendrites of three of these types stratified outside of the cholinergic bands and differed from directional selective ganglion cells (DSGCs) morphologically. These cells were negative for Brn-3b and positive for both calretinin and CART retina markers. The remaining two types were identified as putative On-Off and On-DSGCs. This Cre mouse line could be useful for further studies of the molecular and functional properties of BGCs in mice.
Copyright © 2012 Wiley Periodicals, Inc.
Figures
Similar articles
-
Cre-mediated recombination efficiency and transgene expression patterns of three retinal bipolar cell-expressing Cre transgenic mouse lines.Mol Vis. 2013 Jun 12;19:1310-20. Print 2013. Mol Vis. 2013. PMID: 23805038 Free PMC article.
-
Pou4f2 knock-in Cre mouse: A multifaceted genetic tool for vision researchers.Mol Vis. 2016 Jun 23;22:705-17. eCollection 2016. Mol Vis. 2016. PMID: 27390513 Free PMC article.
-
Heterogeneous transgene expression in the retinas of the TH-RFP, TH-Cre, TH-BAC-Cre and DAT-Cre mouse lines.Neuroscience. 2015 Oct 29;307:319-37. doi: 10.1016/j.neuroscience.2015.08.060. Epub 2015 Aug 31. Neuroscience. 2015. PMID: 26335381 Free PMC article.
-
Characterization of transgenic mouse lines expressing Cre recombinase in the retina.Neuroscience. 2010 Jan 13;165(1):233-43. doi: 10.1016/j.neuroscience.2009.10.021. Epub 2009 Oct 23. Neuroscience. 2010. PMID: 19837136 Free PMC article.
-
Transgenic mice expressing Cre-recombinase specifically in retinal rod bipolar neurons.Invest Ophthalmol Vis Sci. 2005 Oct;46(10):3515-20. doi: 10.1167/iovs.04-1201. Invest Ophthalmol Vis Sci. 2005. PMID: 16186328
Cited by
-
Wide-field diffuse amacrine cells in the monkey retina contain immunoreactive Cocaine- and Amphetamine-Regulated Transcript (CART).Peptides. 2016 Oct;84:22-35. doi: 10.1016/j.peptides.2016.08.007. Epub 2016 Aug 25. Peptides. 2016. PMID: 27568514 Free PMC article.
-
Cell-specific cre recombinase expression allows selective ablation of glutamate receptors from mouse horizontal cells.PLoS One. 2013 Dec 12;8(12):e83076. doi: 10.1371/journal.pone.0083076. eCollection 2013. PLoS One. 2013. PMID: 24349437 Free PMC article.
-
An extracellular biochemical screen reveals that FLRTs and Unc5s mediate neuronal subtype recognition in the retina.Elife. 2015 Dec 2;4:e08149. doi: 10.7554/eLife.08149. Elife. 2015. PMID: 26633812 Free PMC article.
-
Organization of the dorsal lateral geniculate nucleus in the mouse.Vis Neurosci. 2017 Jan;34:E008. doi: 10.1017/S0952523817000062. Vis Neurosci. 2017. PMID: 28965501 Free PMC article. Review.
-
The M6 cell: A small-field bistratified photosensitive retinal ganglion cell.J Comp Neurol. 2019 Jan 1;527(1):297-311. doi: 10.1002/cne.24556. Epub 2018 Nov 11. J Comp Neurol. 2019. PMID: 30311650 Free PMC article.
References
-
- Amthor FR, Oyster CW, Takahashi ES. Morphology of on-off direction-selective ganglion cells in the rabbit retina. Brain Res. 1984;298:187–190. - PubMed
-
- Amthor FR, Oyster CW, Takahashi ES. Quantitative morphology of rabbit retinal ganglion cells. Proc R Soc Lond B Biol Sci. 1983;217:341–355. - PubMed
-
- Amthor FR, Takahashi ES, Oyster CW. Morphologies of rabbit retinal ganglion cells with complex receptive fields. J Comp Neurol. 1989;280:97–121. - PubMed
-
- Badea TC, Nathans J. Quantitative analysis of neuronal morphologies in the mouse retina visualized by using a genetically directed reporter. J Comp Neurol. 2004;480:331–351. - PubMed
Publication types
MeSH terms
Substances
Grants and funding
LinkOut - more resources
Full Text Sources
Other Literature Sources
Molecular Biology Databases
