Review
. 2013 Jul;26(7):872-84.
doi: 10.1002/nbm.2869. Epub 2012 Dec 6.

MRI reporter genes: applications for imaging of cell survival, proliferation, migration and differentiation

Affiliations
Review

MRI reporter genes: applications for imaging of cell survival, proliferation, migration and differentiation

Moriel H Vandsburger et al. NMR Biomed. 2013 Jul.

Abstract

Molecular imaging strives to detect molecular events at the level of the whole organism. In some cases, the molecule of interest can be detected either directly or with targeted contrast media. However many genes and proteins and particularly those located in intracellular compartments are not accessible for targeted agents. The transcriptional regulation of these genes can nevertheless be detected, although indirectly, using reporter gene encoding for readily detectable proteins. Such reporter proteins can be expressed in the tissue of interest by genetically introducing the reporter gene in the target cells. Imaging of reporter genes has become a powerful tool in modern biomedical research. Typically, expression of fluorescent and bioluminescent proteins and the reaction product of expressed enzymes and exogenous substrates were examined using in vitro histological methods and in vivo whole body imaging methods. Recent advances in MRI reporter gene methods raised the possibility that MRI could become a powerful tool for concomitant high-resolution anatomical and functional imaging and for imaging of reporter gene activity. An immediate application of MRI reporter gene methods was by monitoring gene expression patterns in gene therapy and in vivo imaging of the survival, proliferation, migration and differentiation of pluripotent and multipotent cells used in cell-based regenerative therapies for cancer, myocardial infarction and neural degeneration. In this review, we characterized a variety of MRI reporter gene methods based on their applicability to report cell survival/proliferation, migration and differentiation. In particular, we discussed which methods were best suited for translation to clinical use in regenerative therapies.


Conflict of interest statement

Conflicts of Interest

None of the authors responsible for creation of this review article have any conflicts of interest to report.

Figures
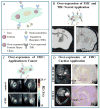
Figure 1
Figure 1. Iron binding MRI reporter genes for imaging of cell survival and proliferation
(A) Representative schematic of a cell and the iron binding proteins most commonly used as MRI reporter proteins. Iron is transported into cells from holo-transferrin through the transferrin receptor (TfR), after which it is stored by ferritin. Over-expression of components of cellular iron storage enables MRI detection by increasing cellular iron content and altering T2 relaxation. Changes in the expression of iron binding proteins in subsequent representative studies are demonstrated using modifications to this schematic. (B) Constitutive over-expression of both ferritin heavy chain (FHC) and the TfR (top) in mouse neural stem cells enabled visual detection of only 2500 cells on T2*-weighted images following implantation into the mouse brain (bottom). The diagram on the left illustrates the locations of the cortex (ctx), striatum (stm), and injection site (is) (This material is reproduced with permission from John Wiley & Sons, Inc. and Deans et al. (7)). (C) Over-expression of FHC (top) in C6-glioma cancer cells resulted in significantly increased tumor R2 as compared to control tumors (bottom) (This material is reproduced with permission from Neoplasia and Cohen et al. (8)). (D) Implantation of C2C12 skeletal myoblast cells into the infarct zone of the mouse heart following MI resulted in a noticeable signal void at the site of cell proliferation only in FHC over-expressing cells (same mechanism as in C) (This material is reproduced with permission from John Wiley & Sons, Inc. and Naumova et al. (12)). Tissue staining of histological sections correlated the location of the signal void with that of grafted FHC over-expressing cells.
Figure 2
Figure 2. Mechanisms of enhanced T2/T2* contrast using MRI reporter genes for imaging of cell survival and proliferation
(A) Targeted delivery of holo-transferrin conjugated monocrystalline iron oxide nanoparticles (Tf-MION) to an engineered transferrin receptor (ETfR) lacking the iron regulatory element (reporter protein) enabled rapid cellular accumulation of MION particles (top). Constitutive expression of ETfR in flank tumors (white arrows) in mice did not induce image contrast (bottom left) in the absence of holo-transferrin-MION. However, administration of Tf-MION results in significant signal loss on T2 and T2* weighted images (bottom middle) in ETfR expressing tumors (left tumor). The change from baseline R2 was significant in ETfR tumors (bottom right) (This material is reproduced with permission from Nature Publishing Group and Weissleder et al. (25)). (B) MagA, a protein adapted from magnetotactic bacteria for use as an MRI reporter gene, uses endogenous iron to produce magnetic nanoparticles within magA expressing cells. Injection of magA expressing cells into the brains of mice results in pronounced signal attenuation on T2*-weighted images as early as five days after injection (top, arrow), resulting from the high density of produced magnetic nanoparticles (bottom) (This material is reproduced with permission from John Wiley & Sons, Inc. and Zurkiya et al. (42)).
Figure 3
Figure 3. Expression of β-galactosidase as an MRI reporter enzyme for imaging of cell survival and proliferation
β-galactosidase (β-gal), an inveterate reporter enzyme in biomedical research, is traditionally used in combination with histological techniques. Recently, a number of studies have sought to use β-gal as an enzyme for activation of exogenously delivered MRI contrast agents capable of producing contrast via a range of mechanisms. (A) EgadME, an engineered gadolinium based contrast agent (top) maintains the gadolinium ion in a water inaccessible state until activation by β-gal expression. Xenopus embryos were injected with EgadME at the two-cell stage, but only the descendents of the single cell that expressed LacZ (the gene which encodes for β-gal) demonstrate increased signal intensity on T1-weighted MR images (middle) and whole embryo β-gal staining (bottom) acquired at a later embryonic milestone (This material is reproduced with permission from John Wiley & Sons, Inc. and Louie et al. (16)). (B) A gadolinium based contrast agent is activated by β-gal activity, and further aggregates to enhance T1-relaxation upon reaction with native tyrosinase activity (top). Application in vivo in cancer cells (white circles) implanted in the flank of a mouse demonstrated prolonged signal enhancement on T1-weighted images only in tumors expressing LacZ (bottom) (Reprinted (adapted) with permission from Arena et al. Bioconjugate Chemistry. 2011;22:2625–2635. (19)). (C) Borrowing directly from histological staining techniques, the interaction between β-gal and a staining salt (top) in the presence of ferric ammonium citrate (FAC) results in chelated ferric iron that produces a dark stain in histology, and T2* contrast in the presence of LacZ expressing cells. Images acquired prior to (bottom left) and after (bottom right) intratumoral injection of the staining salt S-gal and FAC demonstrate hypo-intensity only in the LacZ expressing tumor (This material is reproduced with permission from John Wiley & Sons, Inc. and Cui et al. (17)). (D) A 19F-labeled contrast agent that, upon reaction with β-gal, chelates iron and produces T2 contrast on 1H-MR images (top). Intratumoral injection of this agent led to significant T2 shortening in LacZ expressing (purple arrows), but not control tumors in mice (bottom) (Reprinted (adapted) with permission from Yu et al. Bioconjugate Chemistry. 2012. 23(3): 596–603. (20)).
Figure 4
Figure 4. Targeted MR imaging of cell surface expressing reporter proteins
(A) Constitutive expression of a biotinylated transmembrane receptor (BAP-TM) as a reporter protein (left) enabled in vivo imaging of gene expression using streptavidin conjugated to either magnetic nanoparticles (right) or peroxidase sensitive gadolinium contrast agents (bottom). Following injection of magnetic nanoparticle conjugated streptavidin, tumors expressing BAP-TM demonstrate significantly reduced T2 values (right) (21). In contrast, administration of peroxidase sensitive gadolinium and streptavidin results in hyper-intensity in BAP-TM expressing tumors on T1 weighted images (bottom, red arrows) (21)(Reprinted with permission from the Nature Publishing Group and Tannous et al. (21)). (B) Embryonic stem cells (ESC) engineered to express membrane bound HA and myc antigens as reporters (top) were implanted into the infarct zone of the mouse heart following myocardial infarction (bottom). T2*-weighted MR imaging of the heart after intravenous administration of a targeted - iron oxide nanoparticle conjugated - contrast agent demonstrated signal voids in the presence of proliferating, and teratoma forming, ESC (bottom) (This material is reproduced with permission from John Wiley & Sons, Inc. and Chung et al. (23)).
Figure 5
Figure 5. CEST MRI of reporter peptides
(A) CEST-MRI uses the exchange of radio frequency labeling from the protons of the CEST contrast agent to those of nearby water molecules (left, grey arrow) (Reprinted with permission from the Nature Publishing Group and Gilad et al. (30)). The saturation of spins resonating at the CEST agent frequency (green bar at NH peak in middle), after allowing for exchange, results in a decrease in the magnitude of the water peak (30). (Right) Polypeptides with strong CEST potential were dissolved in phosphate buffered saline (PBS) (magnitude) and imaged using three different saturation frequencies (This material is reproduced with permission from John Wiley & Sons, Inc. and McMahon et al. (48)). A merged image of magnetization transfer maps, normalized to maximum signal intensity and color coded based on saturation frequency, illustrates the ability to image several unique CEST labels for several polypeptide reporters (DIACEST) (48). (B) An engineered CEST reporter peptide with enhanced amide magnetization transfer, termed the lysine rich protein (LRP) was transfected into glioma cells prior to implantation in the mouse brain (30). Anatomical reference images (top) illustrate similar signal intensity in LRP and control xenografts (30). In contrast, the map of changes in signal intensity in CEST experiments highlights the location of LRP expressing xenografts (Reprinted with permission from the Nature Publishing Group and Gilad et al. (30)). (C) Improved pulse sequence and post processing techniques have led to enhanced sensitivity and accuracy of CEST-MRI. (i) T2-weighted scout image demonstrates signal enhancement at the site of a gliosarcoma tumor in the mouse brain. Gliosarcoma cells are known to demonstrate CEST contrast through amide (NH) proton transfer. (ii) B0 shift map (acquired using the WASSR technique (31)) illustrates the range of B0 inhomogeneity across the mouse brain. (iii) Conventional measurement of magnetization transfer ratio (MTR) illustrates the effect of B0 inhomogeneities on the accuracy of conventional CEST-MRI. (iv) Implementation of the LOVARS method, represented by a threshold LOVARS imaginary component map super-imposed on a magnitude reconstructed reference image, ameliorates the error introduced by B0 inhomogeneities and enables accurate in vivo MRI of CEST reporters (This material is reproduced with permission from John Wiley & Sons, Inc. and Song et al. (33)).
Figure 6
Figure 6. In vivo imaging of cell migration using ferritin as an MRI reporter gene
(A) Injection of an adenovirus into the sub-ventricular zone (SVZ) of the mouse brain generated a population of ferritin heavy chain (FHC) and ferritin light chain (FLC) over-expressing neural progenitor cells (L*H). Migration of L*H neuroblasts from the SVZ to the olfactory bulb (white arrows) was successfully imaged using T2*-weighted MRI. The asterisk (*) in images indicates the injection sites of control (top asterisk) and L*H-adeno viri (bottom asterisk) (Reprinted with permission from Elsevier and Iordanova et al. (52)). (B) R2 mapping of human ovarian cancer tumors in the hind limbs of mice 7 days after intraperitoneal injection of either control (top) or FHC over-expressing fibroblasts (bottom). Preferential recruitment of fibroblasts to the tumor rim is visualized as significantly elevated R2 values in mice receiving FHC over-expressing (bottom), but not control (top) fibroblasts (54).
Figure 7
Figure 7. MRI reporter gene imaging of endothelial cell differentiation
Use of double transgenic mice, in which tTA mediated ferritin over-expression was regulated by transcription of the vascular endothelial (VE) cadherin promoter, enabled in utero and in vivo detection of endothelial cell differentiation (37). (a) Representative in utero MRI of single transgenic (tTA-Ferritin, left) and double transgenic (VE-cadherin-Ferritin, right) embryos demonstrated enhanced R2 in the fetal heart (H) and liver (L), as well as in the placenta (P), in the double transgenic embryo (37). (b) At embryonic day 13.5 (E13.5), elevated expression of VE-cadherin in differentiating endothelial cells in the liver and heart resulted in significantly elevated R2 measurements in double transgenic (middle, green) as compared to single transgenic (middle, gray) embryos (37). When the change in R2 over the brain, which demonstrates low VE-cadherin activity at E13.5, was measured, single and double transgenic embryos could be distinctly identified. (c) In the adult mouse, expression of ferritin in vascular endothelial cells was visualized as elevated R2 values in the brain. R2 values measured in the cortex (C), and in the hippocampus (H) were elevated in double transgenic mice (e) as compared to single transgenic mice (e). In the hippocampus, the increase in R2 was significant in all slices through the brain (Reprinted with permission from the Nature Publishing Group and Cohen et al. (37)).

References

    1. Stepanenko OV, Verkhusha VV, Kuznetsova IM, Uversky VN, Turoverov KK. Fluorescent proteins as biomarkers and biosensors: throwing color lights on molecular and cellular processes. Curr Protein Pept Sci. 2008;9(4):338–369. - PMC - PubMed
    1. Waidmann MS, Bleichrodt FS, Laslo T, Riedel CU. Bacterial luciferase reporters: The Swiss army knife of molecular biology. Bioengineered Bugs. 2011;2(1):8–16. - PubMed
    1. Gilad A, Ziv K, McMahon M, van Zijl P, Neeman M, Bulte J. MRI reporter genes. J Nucl Med. 2008;49(12):1905–1908. - PMC - PubMed
    1. Gilad A, Winnard PJ, van Zijl P, Bulte J. Developing MR reporter genes: promises and pitfalls. NMR in Biomed. 2007;20(3):275–290. - PubMed
    1. Shapiro EM, Skrtic S, Koretsky AP. Sizing it up: Cellular MRI using micron-sized iron oxide particles. Magn Reson Med. 2005;53(2):329–338. - PubMed

Publication types