. 2013 Mar;83(3):253-64.
doi: 10.1002/cyto.a.22241. Epub 2012 Dec 6.

Visible and near infrared fluorescence spectral flow cytometry

Affiliations

Visible and near infrared fluorescence spectral flow cytometry

John P Nolan et al. Cytometry A. 2013 Mar.

Abstract

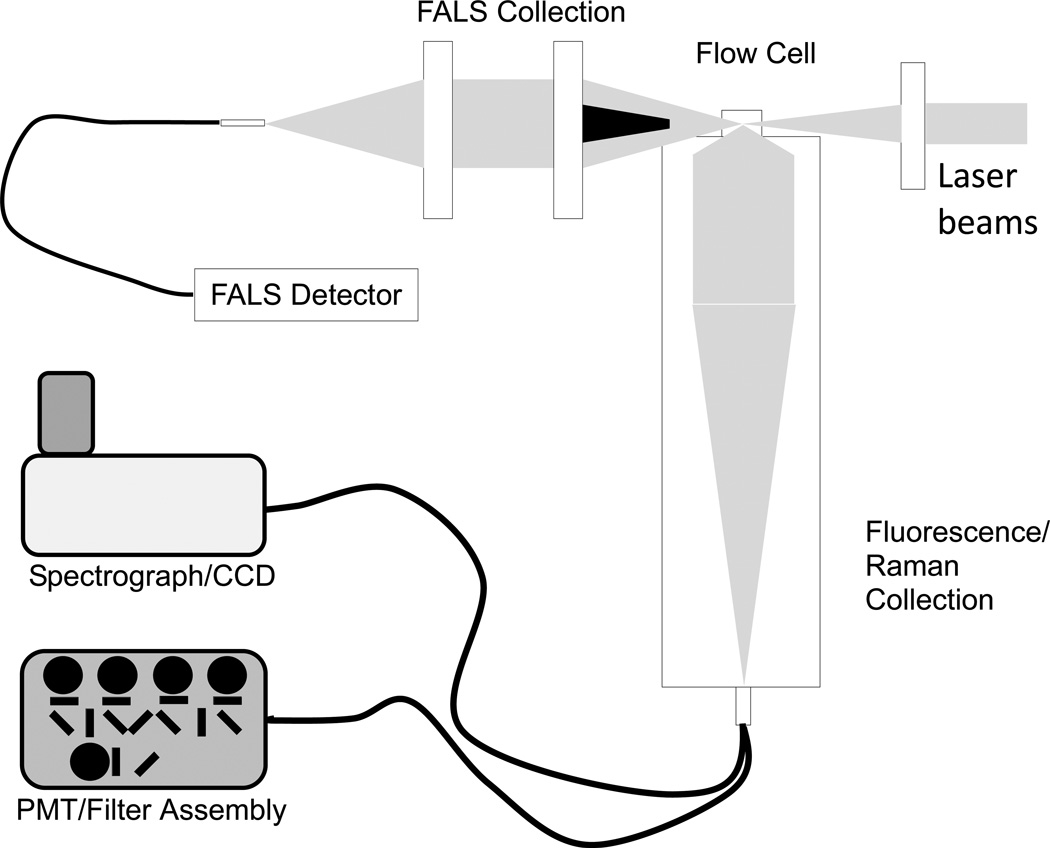
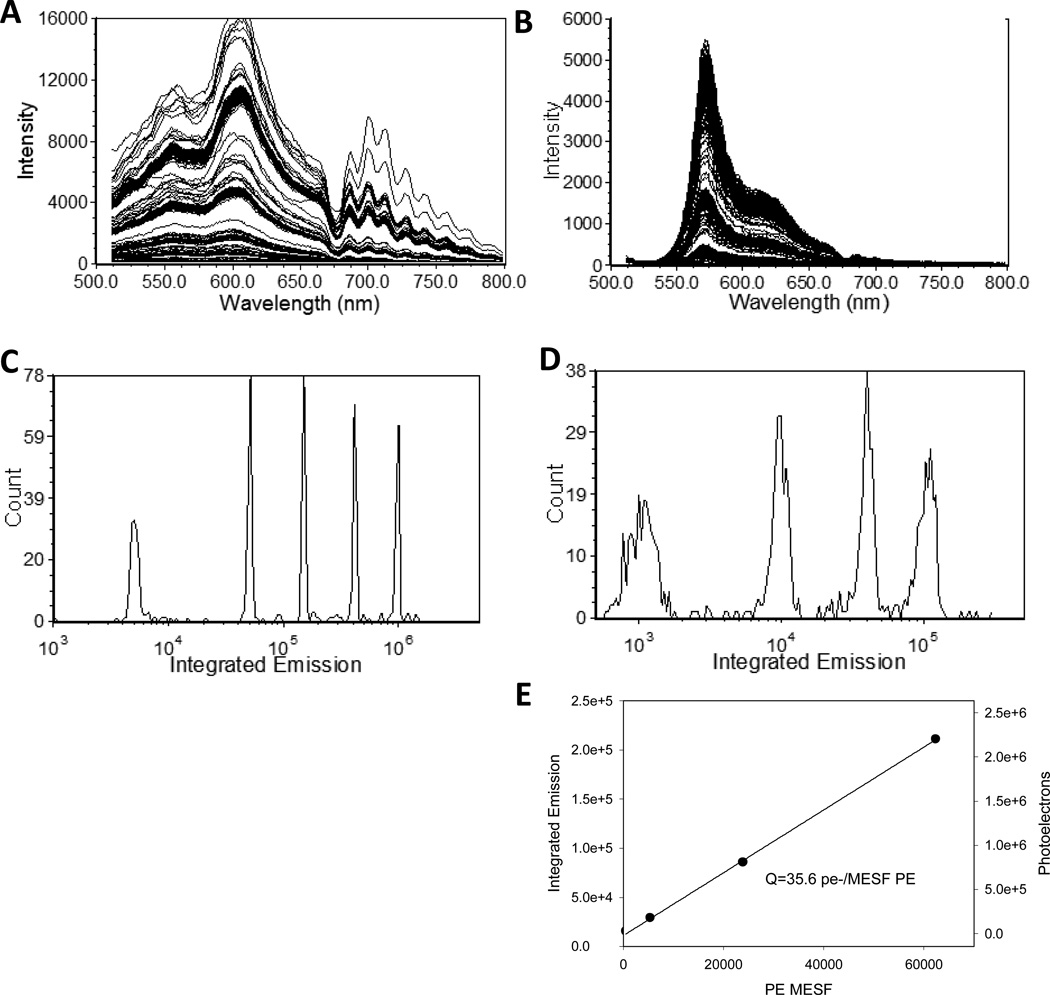
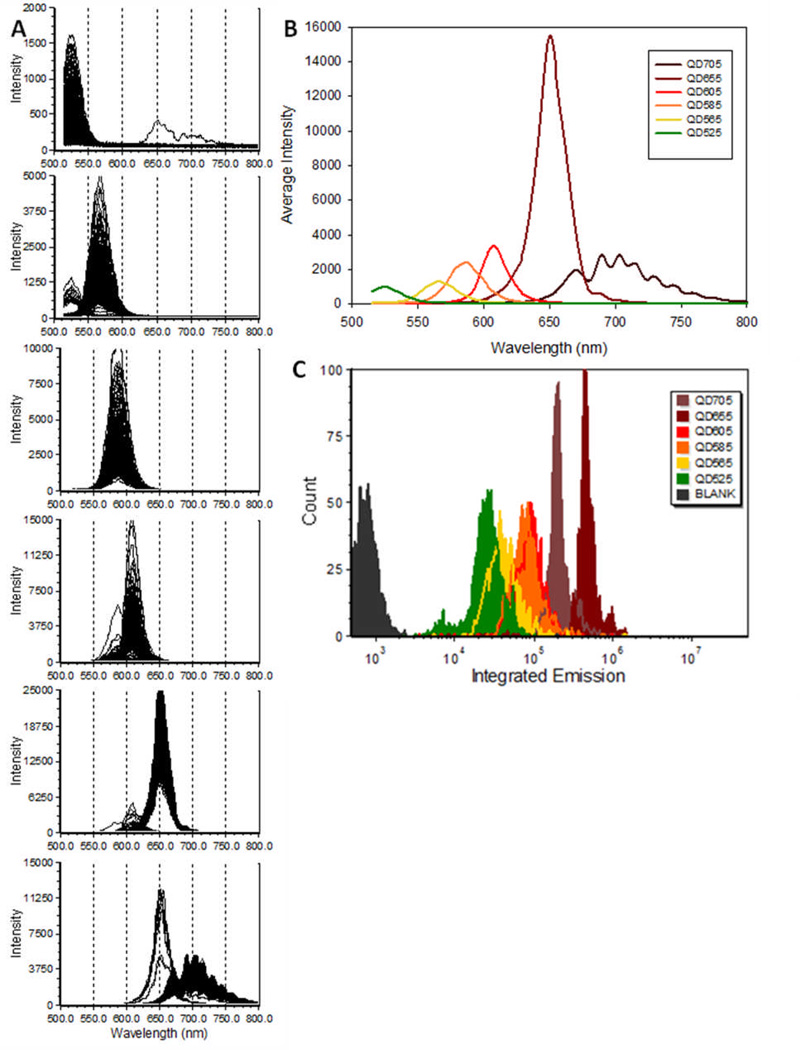
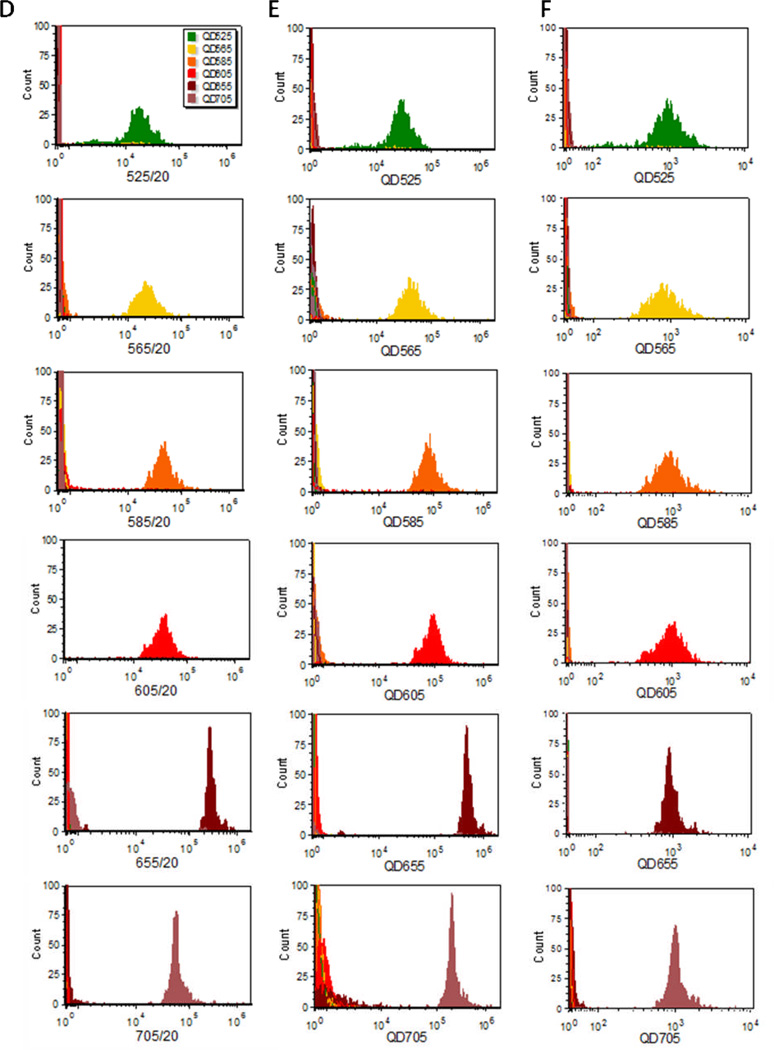
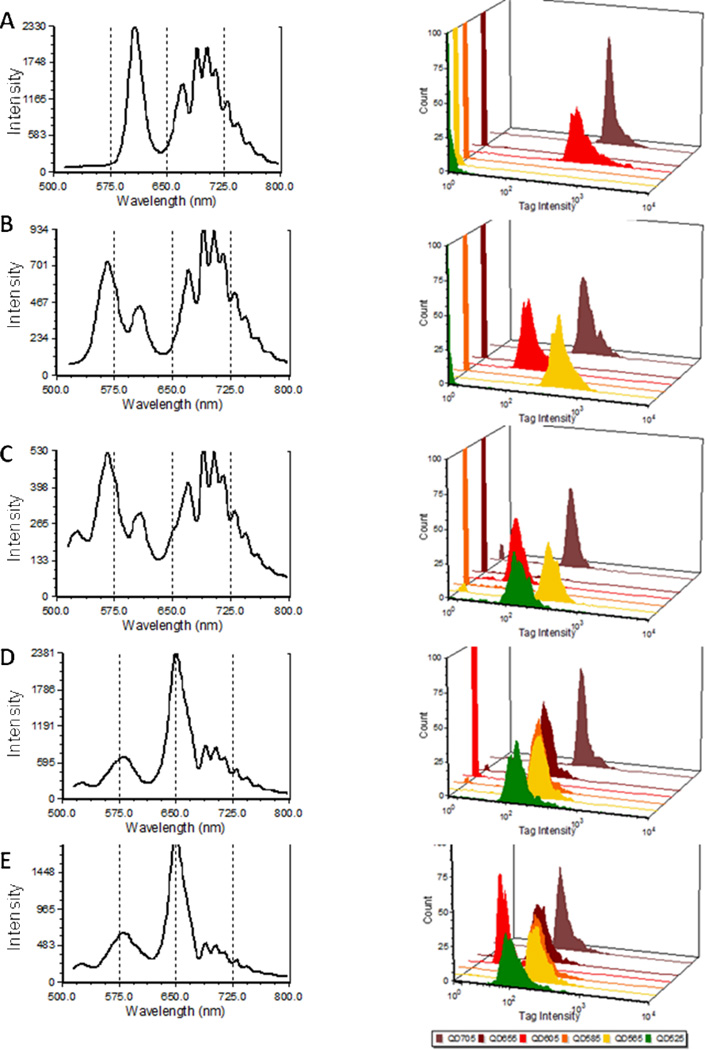
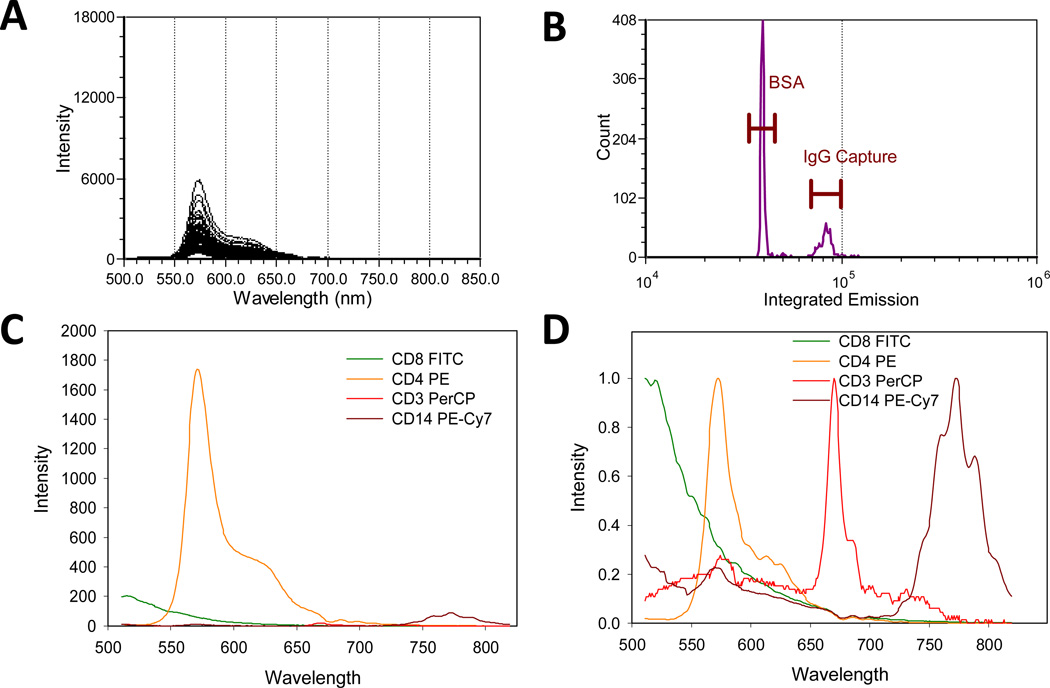
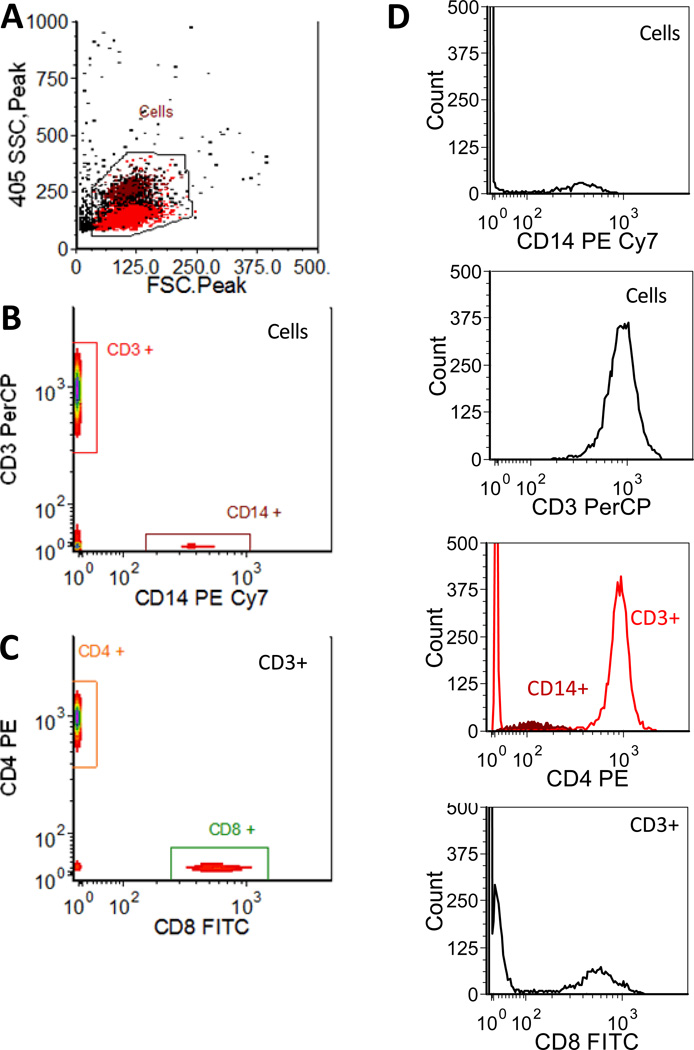
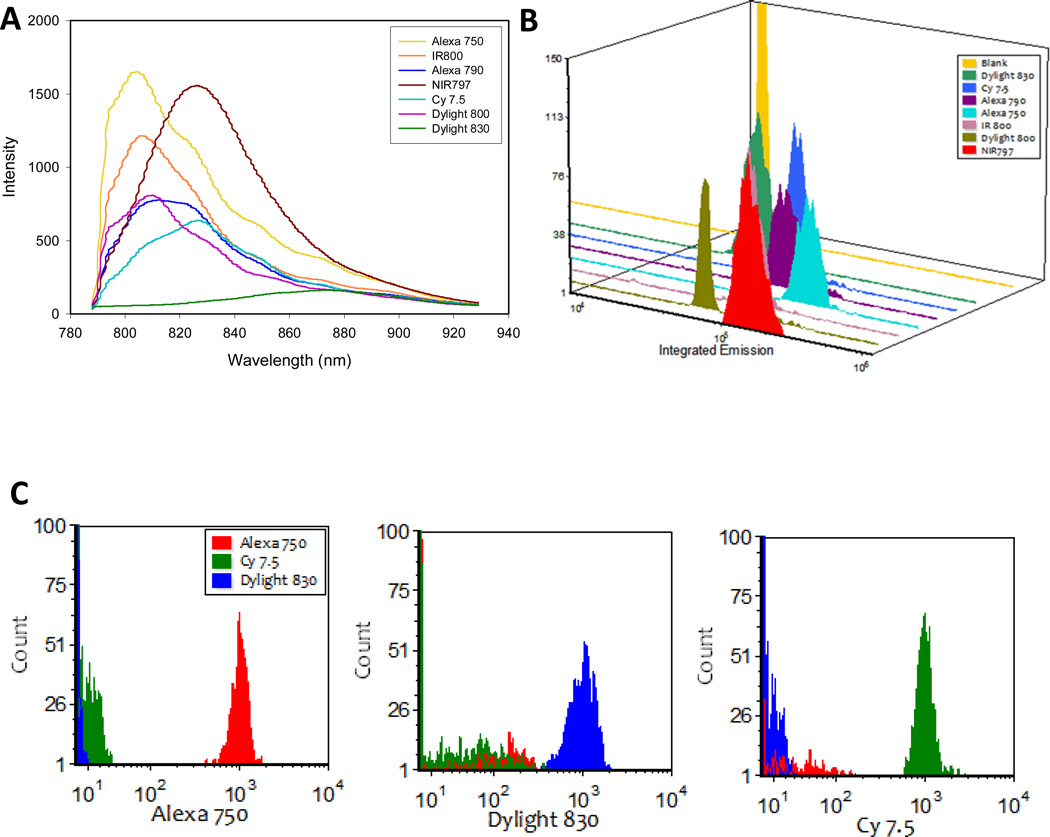
There is a long standing interest in measuring complete emission spectra from individual cells in flow cytometry. We have developed flow cytometry instruments and analysis approaches to enable this to be done routinely and robustly. Our spectral flow cytometers use a holographic grating to disperse light from single cells onto a CCD for high speed, wavelength-resolved detection. Customized software allows the single cell spectral data to be displayed and analyzed to produce new spectra-derived parameters. We show that familiar reference and calibration beads can be employed to quantitatively assess instrument performance. We use microspheres stained with six different quantum dots to compare a virtual bandpass filter approach with classic least squares (CLS) spectral unmixing, and then use antibody capture beads and CLS unmixing to demonstrate immunophenotyping of peripheral blood mononuclear cells using spectral flow cytometry. Finally, we characterize and evaluate several near infrared (NIR) emitting fluorophores for use in spectral flow cytometry. Spectral flow cytometry offers a number of attractive features for single cell analysis, including a simplified optical path, high spectral resolution, and streamlined approaches to quantitative multiparameter measurements. The availability of robust instrumentation, software, and analysis approaches will facilitate the development of spectral flow cytometry applications.


Figures

Figure 1
Figure 1
Schematic of a multilaser spectral flow cytometer.
Figure 2
Figure 2
Spectral flow cytometry of reference and calibration particles. (A, B) Single particle spectra and (C, D) integrated emission (512 nm – 819 nm) from (A, C) multifluorophore (UltraRainbow) beads and (B, D) PE-stained calibration (Quantibrite) beads. (E) Plot of mean photons detected vs MESF of the PE stained beads.
Figure 3
Figure 3
Fluorescence spectra of QDot stained beads. A) Individual spectra of beads stained with QD525, QD565, QD585, QD605, QD655, and QD705 (from top to bottom). B) Average single bead spectra from the data shown in (A). C) Integrated intensity histograms from the data shown in (A). D) Intensity histograms from application of virtual bandpass filters to spectral data. E) Intensity histograms from unmixed spectral data using the reference bead spectra. F ) Abundance histograms from unmixed spectral data using the reference bead spectra and intensities.
Figure 3
Figure 3
Fluorescence spectra of QDot stained beads. A) Individual spectra of beads stained with QD525, QD565, QD585, QD605, QD655, and QD705 (from top to bottom). B) Average single bead spectra from the data shown in (A). C) Integrated intensity histograms from the data shown in (A). D) Intensity histograms from application of virtual bandpass filters to spectral data. E) Intensity histograms from unmixed spectral data using the reference bead spectra. F ) Abundance histograms from unmixed spectral data using the reference bead spectra and intensities.
Figure 4
Figure 4
Spectral encoding using Qdots. Average spectra (left) and abundance histograms after spectral unmixing (right) of beads stained with A) two (QD605+QD705), B) three (QD565+QD605+QD705),C) four (QD565+QD585+QD605+QD705), D) five (QD525+QD565+QD585+QD655+QD705), or E) all six Qdots (from top to bottom) as measured by spectral flow cytometry.
Figure 5
Figure 5
Spectral flow cytometry of labeled antibodies on capture beads. (A) Single bead spectra and (B) intensity histograms of a BSA/antibody capture bead cocktail stained with PE-antiCD4 antibody. (C) Average spectra and (D) normalized average spectra of the bright antibody capture beads stained with FITC-antiCD8, PE-antiCD4, PerCP-antiCD3, and PECy7-antiCD14.
Figure 6
Figure 6
Spectral flow cytometry of fluorescence-labeled PBMCs. A) Light scatter histogram showing back gating of CD3 and CD14 positive cells, B) bivariate histogram of CD3 vs CD14 staining, and C) bivariate histogram of CD4 vs CD8 for CD3 positive cells. (D) Single parameter histograms for each marker, with gates indicated.
Figure 7
Figure 7
Spectral flow cytometry of NIR fluorophores. A) Average spectra and B) integrated emission intensity histograms of biotinylated microspheres stained with one each of seven different NIR streptavidin/neutravidin conjugates. (C) Resolution of particles stained with one each of three different NIR fluorochromes using CLS spectral unmixing.

Similar articles

Cited by

References

    1. Asbury CL, Esposito R, Farmer C, van den Engh G. Fluorescence spectra of DNA dyes measured in a flow cytometer. Cytometry. 1996;24:234–242. - PubMed
    1. Buican TN. Real-time Fourier transform spectrometry for fluorescence imaging and flow cytometry. 1990:126.
    1. Dubelaar GBJ, Gerritzen PL, Beeker AER, Jonker RR, Tangen K. Design and first results of CytoBuoy: A wireless flow cytometer for in situ analysis of marine and fresh waters. Cytometry. 1999;37:247–254. - PubMed
    1. Fuller RR, Sweedler JV. Characterizing submicron vesicles with wavelength?resolved fluorescence in flow cytometry. Cytometry. 1996;25:144–155. - PubMed
    1. Gauci M, Vesey G, Narai J, Veal D, Williams K, Piper J. Observation of single?cell fluorescence spectra in laser flow cytometry. Cytometry. 1996;25:388–393. - PubMed

Publication types

Substances

LinkOut - more resources