. 2012 Nov 29:6:312.
doi: 10.3389/fnhum.2012.00312. eCollection 2012.

Intra- and interbrain synchronization and network properties when playing guitar in duets

Affiliations

Intra- and interbrain synchronization and network properties when playing guitar in duets

Johanna Sänger et al. Front Hum Neurosci. .

Abstract

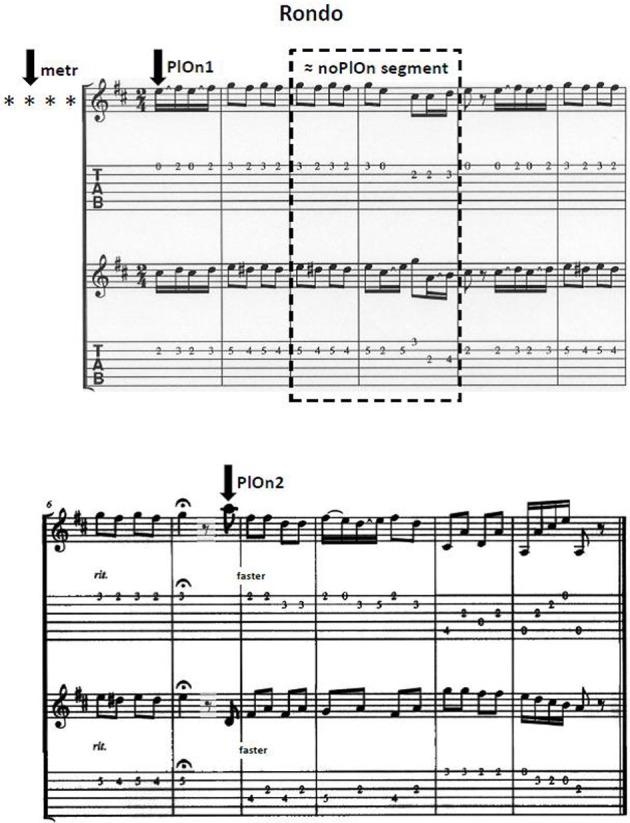
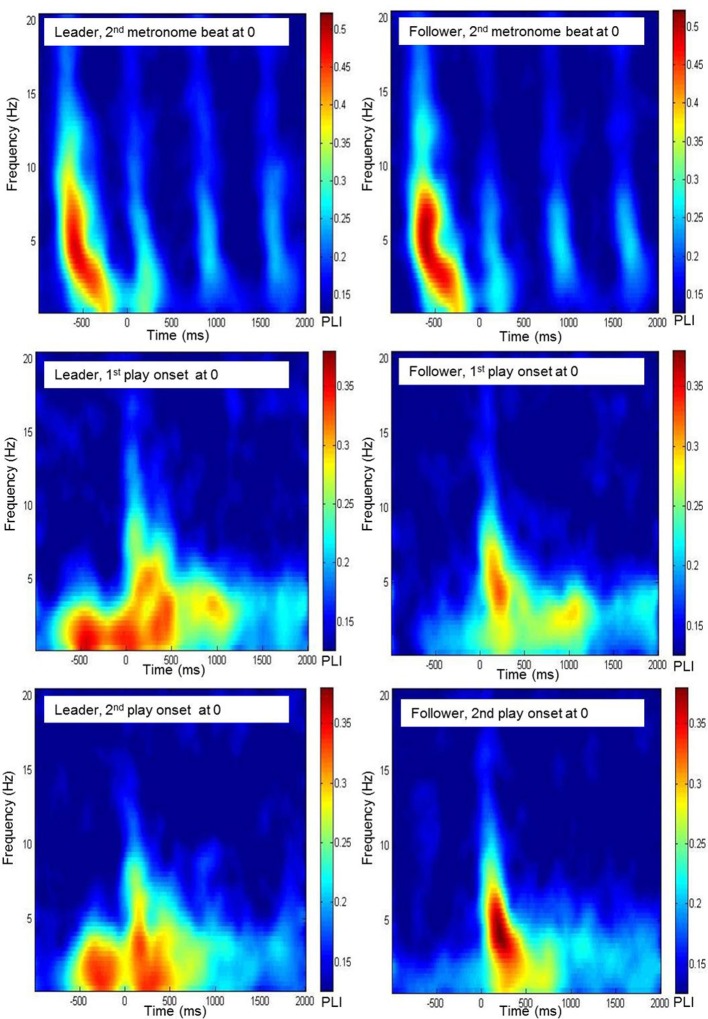
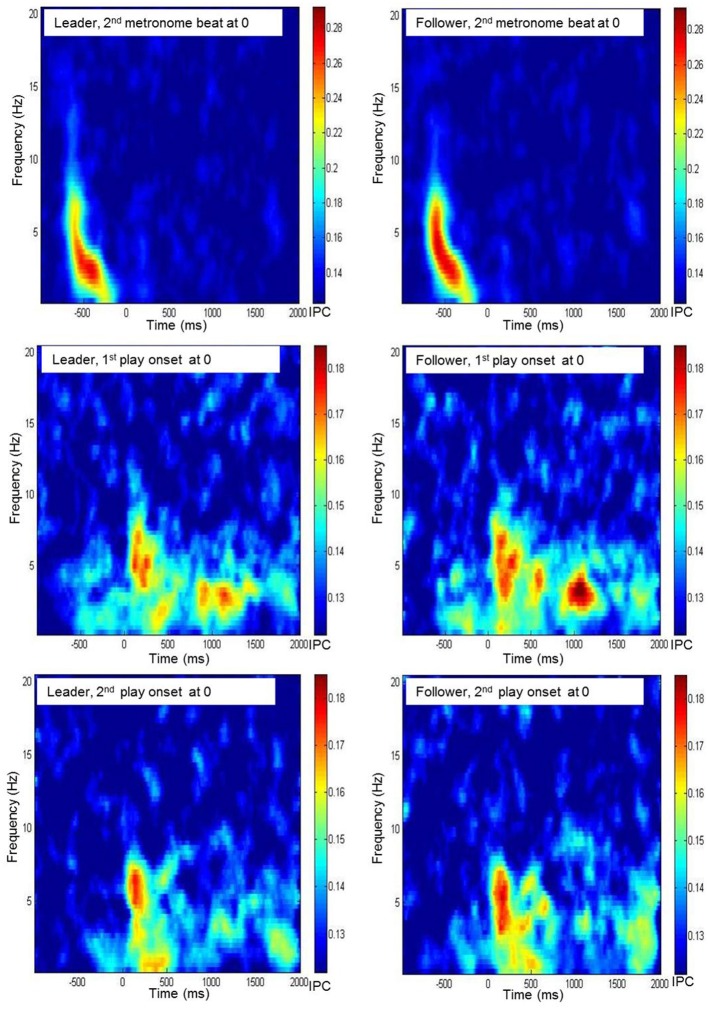
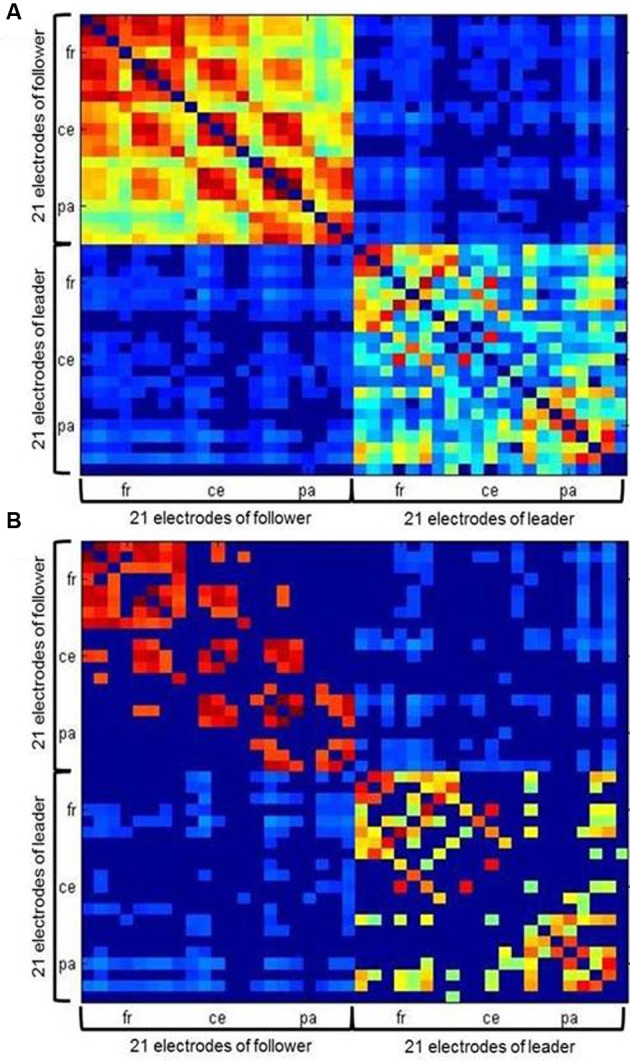
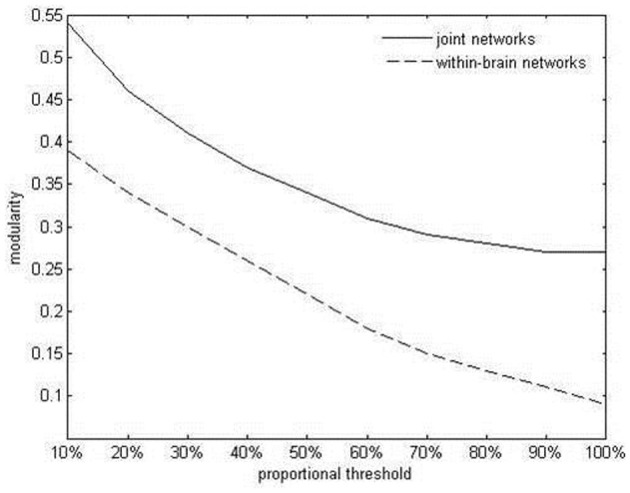
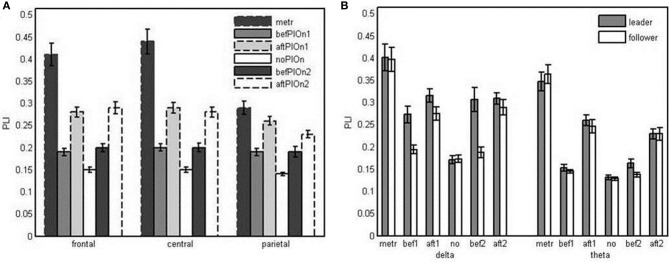
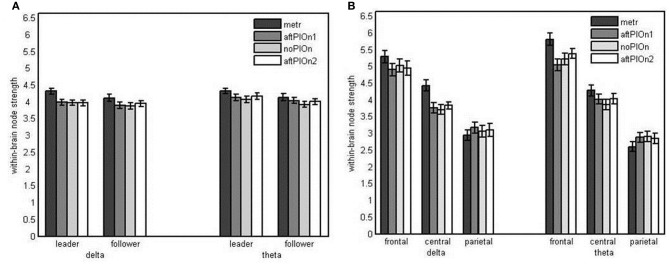
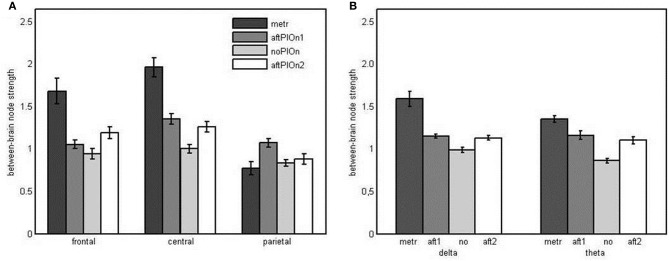
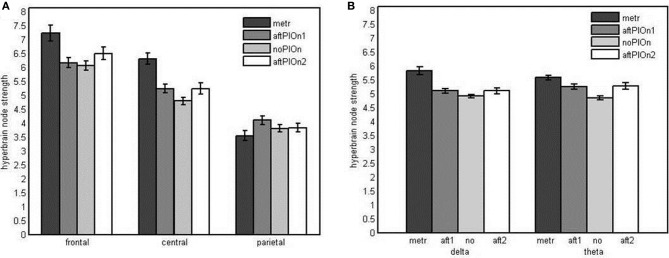
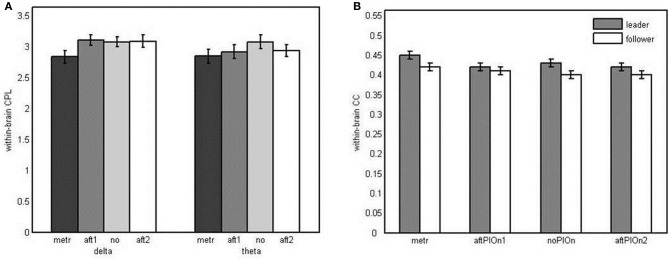
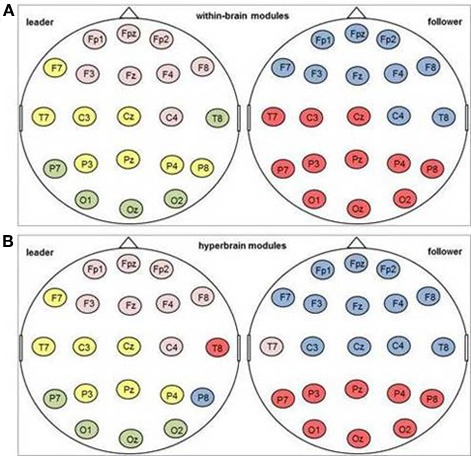
To further test and explore the hypothesis that synchronous oscillatory brain activity supports interpersonally coordinated behavior during dyadic music performance, we simultaneously recorded the electroencephalogram (EEG) from the brains of each of 12 guitar duets repeatedly playing a modified Rondo in two voices by C.G. Scheidler. Indicators of phase locking and of within-brain and between-brain phase coherence were obtained from complex time-frequency signals based on the Gabor transform. Analyses were restricted to the delta (1-4 Hz) and theta (4-8 Hz) frequency bands. We found that phase locking as well as within-brain and between-brain phase-coherence connection strengths were enhanced at frontal and central electrodes during periods that put particularly high demands on musical coordination. Phase locking was modulated in relation to the experimentally assigned musical roles of leader and follower, corroborating the functional significance of synchronous oscillations in dyadic music performance. Graph theory analyses revealed within-brain and hyperbrain networks with small-worldness properties that were enhanced during musical coordination periods, and community structures encompassing electrodes from both brains (hyperbrain modules). We conclude that brain mechanisms indexed by phase locking, phase coherence, and structural properties of within-brain and hyperbrain networks support interpersonal action coordination (IAC).

Keywords: EEG hyperscanning; cortical phase synchronization; functional connectivity; graph theory; joint action; music; social interaction.


Figures

Figure 1
Figure 1
Note sheet of the adapted version of the Rondo in D-Major by C.G. Scheidler. Intially, three segments of 3000 ms each were analyzed, each one beginning 1000 ms before the respective stimulus and ending 2000 ms after it. metr: the segment of preparatory tempo setting was time-locked to the second of four metronome beats preceding each trial; PlOn1: the segment around the first play onset was time-locked to the first play onset of the leading guitarist; the segment for the second play onset (PlOn2) was defined accordingly.
Figure 2
Figure 2
Time-frequency diagrams of the grand average of the phase locking index, averaged across frontal electrodes (Fp1, Fpz, Fp2, F7, F3, Fz, F4, F8) for leaders and followers during preparatory tempo setting and around coordinated play onsets.
Figure 3
Figure 3
Time frequency diagrams of the grand average of interbrain phase coherence, averaged across all electrode pairs of Fz of the leader's resp. the follower's brain with any electrode of the partner's brain during preparatory tempo setting and around coordinated play onsets.
Figure 4
Figure 4
Example of a hyperbrain network with (A) an absolute threshold of 0.12 and (B) an additional proportional threshold of 30 percent applied separately for within- and between brain connections. Within-brain coherence of the follower is captured in the upper left, within-brain coherence of the leader in the lower right. Between-brain coherence is shown in the upper right and lower left of the matrix. The auto-coherence on the main diagonal is set to zero. For each interaction partner, 21 electrodes are arranged in the following order: Fp1, Fpz, Fp2, F7, F3, Fz, F4, F8, T7, C3, Cz, C4, T8, P7, P3, Pz, P4, P8, O1, Oz, and O2 from top (follower) to bottom (leader) and left (follower) to right (leader).
Figure 5
Figure 5
Average within-brain and hyperbrain network modularity in the delta band, after the first play onset, as a function of thresholding.
Figure 6
Figure 6
(A) Bar plot presentation of the interaction of segment and site in the four-way repeated measures ANOVA of Phase Locking Index (PLI). metr = 500 ms during preparatory tempo setting (after the first metronome beat); bef/aftPlOn1 = 500 ms before/after the first play onset of the leading guitarist; noPlOn = 500 ms of joint playing without play onset; bef/aftPlOn2 = 500 ms before/after the second play onset of the leading guitarist. (B) Bar plot presentation of the interaction of role and segment in the simple-effects ANOVAs of Phase Locking Index (PLI) for delta and theta frequencies, respectively. metr = 500 ms during preparatory tempo setting (after the first metronome beat); bef/aft1 = 500 ms before/after the first play onset of the leading guitarist; no = 500 ms of joint playing without play onset; bef/aft2 = 500 ms before/after the second play onset of the leading guitarist.
Figure 7
Figure 7
(A) Bar plot presentation of the interaction of role and segment in the simple-effects ANOVA of within-brain node strengths in delta frequencies (for theta frequencies, the interaction was not significant). (B) Bar plot presentation of the interaction of segment and site in the simple-effects ANOVAs of within-brain node strengths in delta and theta frequencies, respectively Note: metr = 500 ms during preparatory tempo setting (after the first metronome beat); bef/aftPlOn1 = 500 ms before/after the first play onset of the leading guitarist; noPlOn = 500 ms of joint playing without play onset; bef/aftPlOn2 = 500 ms before/after the second play onset of the leading guitarist.
Figure 8
Figure 8
(A) Bar plot presentation of the interaction of segment × site in the four-way repeated measures ANOVA of node strengths in the between-brain network. metr = 500 ms during preparatory tempo setting (after the first metronome beat); bef/aftPlOn1 = 500 ms before/after the first play onset of the leading guitarist; noPlOn = 500 ms of joint playing without play onset; bef/aftPlOn2 = 500 ms before/after the second play onset of the leading guitarist. (B) Bar plot presentation of the interaction of segment and frequency in the four-way repeated measures ANOVA of node strengths in the hyperbrain network. metr = 500 ms during preparatory tempo setting (after the first metronome beat); bef/aft1 = 500 ms before/after the first play onset of the leading guitarist; no = 500 ms of joint playing without play onset; bef/aft2 = 500 ms before/after the second play onset of the leading guitarist.
Figure 9
Figure 9
(A) Bar plot presentation of the interaction of segment and site in the four-way repeated measures ANOVA of node strengths in the hyperbrain network. (B) Bar plot presentation of the interaction of segment and frequency in the Four-Way repeated measures ANOVA of node strengths in the hyperbrain network Note: metr = 500 ms during preparatory tempo setting (after the first metronome beat); bef/aftPlOn1 = 500 ms before/after the first play onset of the leading guitarist; noPlOn = 500 ms of joint playing without play onset; bef/aftPlOn2 = 500 ms before/after the second play onset of the leading guitarist.
Figure 10
Figure 10
(A) Bar plot presentation of the interaction of segment and frequency in the three-way repeated measures ANOVA of characteristic path lengths in the within-brain network. (B) Bar plot presentation of the interaction of role and segment in the three-way repeated measures ANOVA of clustering coefficient in the within-brain network Note: metr = 500 ms during preparatory tempo setting (after the first metronome beat); bef/aftPlOn1 = 500 ms before/after the first play onset of the leading guitarist; noPlOn = 500 ms of joint playing without play onset; bef/aftPlOn2 = 500 ms before/after the second play onset of the leading guitarist.
Figure 11
Figure 11
One example for a modular community structure in the delta frequency band after the first coordinated play onset. Electrodes marked in the same color belong to one module. (A) Modules in the within-brain network; (B) modules in the hyperbrain network.

References

    1. Andres F. G., Mima T., Schulman A. E., Dichgans J., Hallett M., Gerloff C. (1999). Functional coupling of human cortical sensorimotor areas during bimanual skill acquisition. Brain 122(Pt 5), 855–870 10.1093/brain/122.5.855 - DOI - PubMed
    1. Astolfi L., Toppi J., De Vico Fallani F., Vecchiato G., Salinari S., Mattia D., et al. (2010). Neuroelectrical hyperscanning measures simultaneous brain activity in human. Brain Topogr. 23, 243–256 10.1007/s10548-010-0147-9 - DOI - PubMed
    1. Babiloni F., Astolfi L., Cincotti F., Mattia D., Tocci A., Tarantino A., et al. (2007a). Cortical activity and connectivity of human brain during the prisoner's dilemma: an EEG hyperscanning study, in Engeneering in Medicine and Biological Society 2007. EMBS 2007. 29th Annual International Conference of the IEEE (Lyon, France: ). 10.1109/IEMBS.2007.4353452 - DOI - PubMed
    1. Babiloni F., Cincotti F., Mattia D., De Vico Fallani F., Tocci A., Bianchi L., et al. (2007b). High resolution EEG hyperscanning during a card game, in Engeneering in Medicine and Biological Society 2007. EMBS 2007. 29th Annual International Conference of the IEEE (Lyon, France: ). 10.1109/IEMBS.2007.4353453 - DOI - PubMed
    1. Basar-Eroglu C., Basar E., Demiralp T., Schurmann M. (1992). P300-response: possible psychophysiological correlates in delta and theta frequency channels. A review. Int. J. Psychophysiol. 13, 161–179 - PubMed

LinkOut - more resources