. 2012 Nov 30:3:262.
doi: 10.3389/fpls.2012.00262. eCollection 2012.

Transphosphorylation of E. coli Proteins during Production of Recombinant Protein Kinases Provides a Robust System to Characterize Kinase Specificity

Affiliations

Transphosphorylation of E. coli Proteins during Production of Recombinant Protein Kinases Provides a Robust System to Characterize Kinase Specificity

Xia Wu et al. Front Plant Sci. .

Abstract

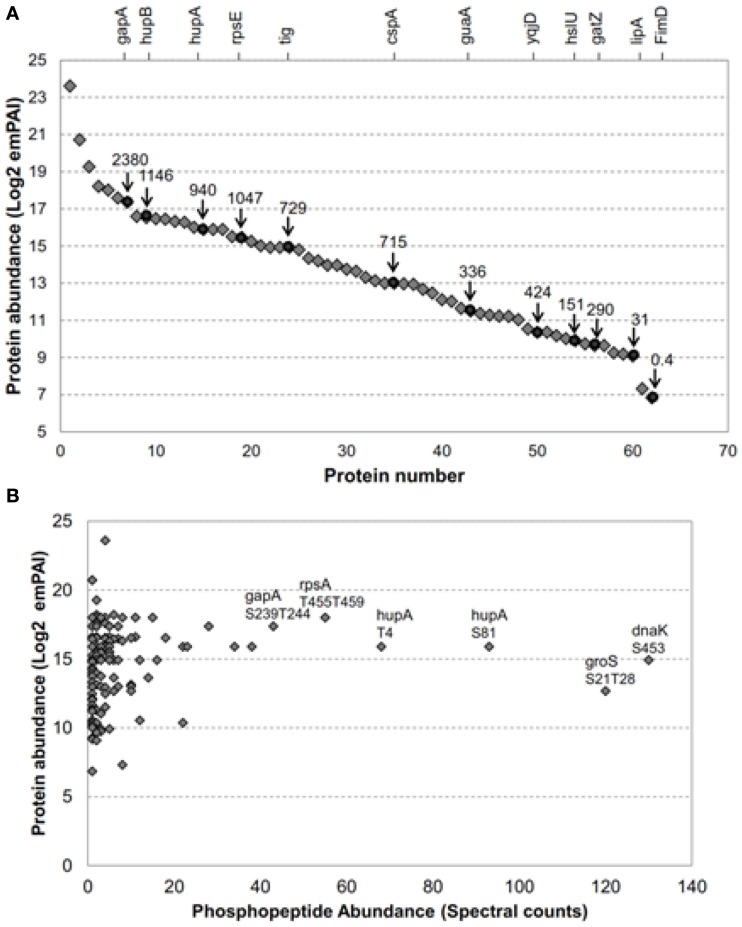
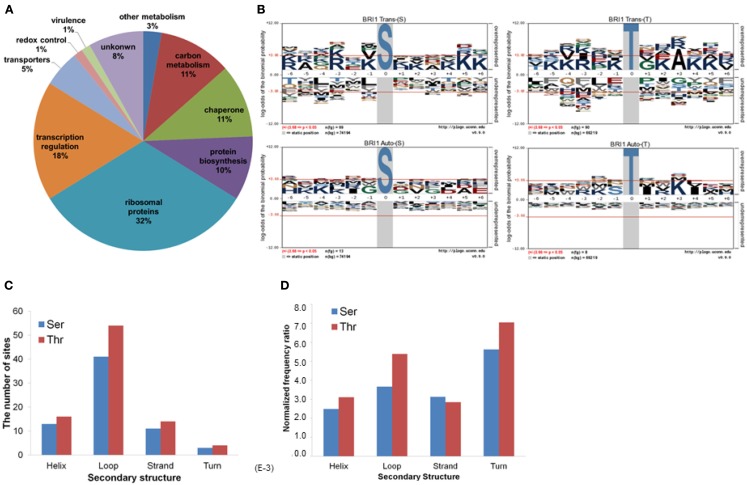
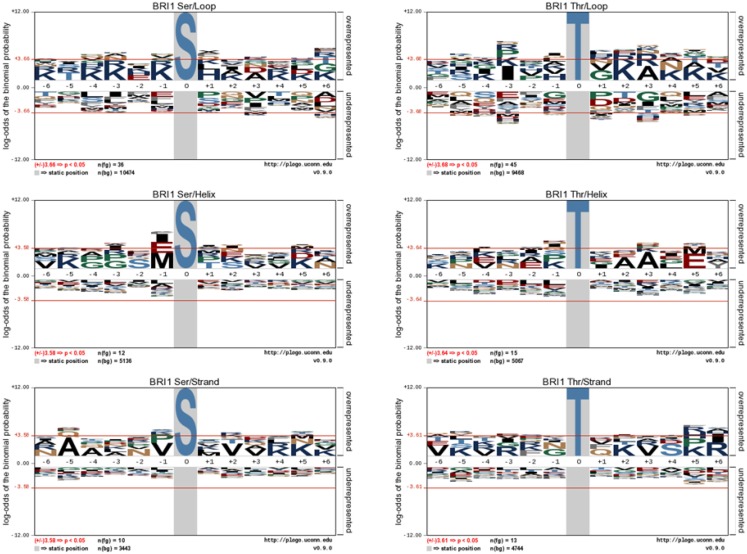
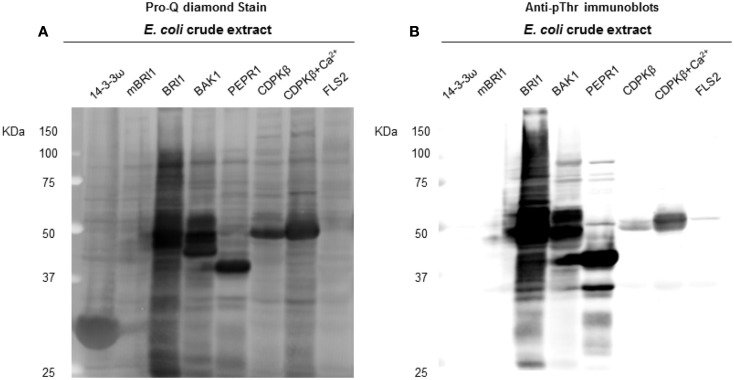
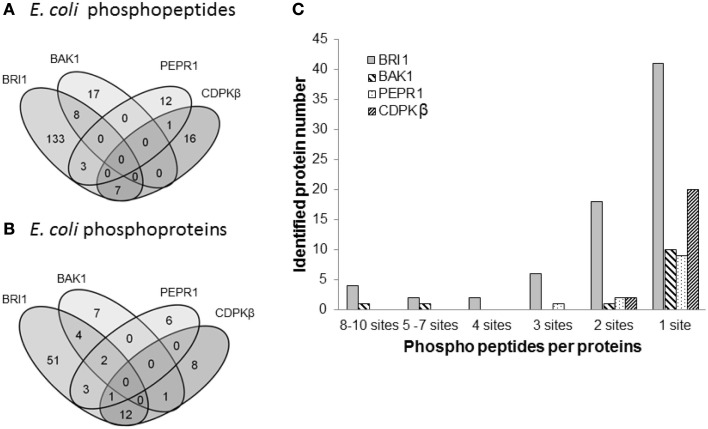
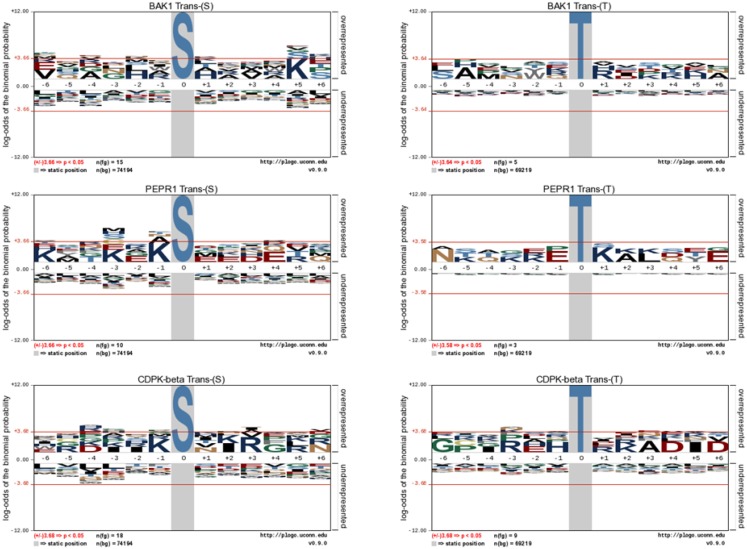
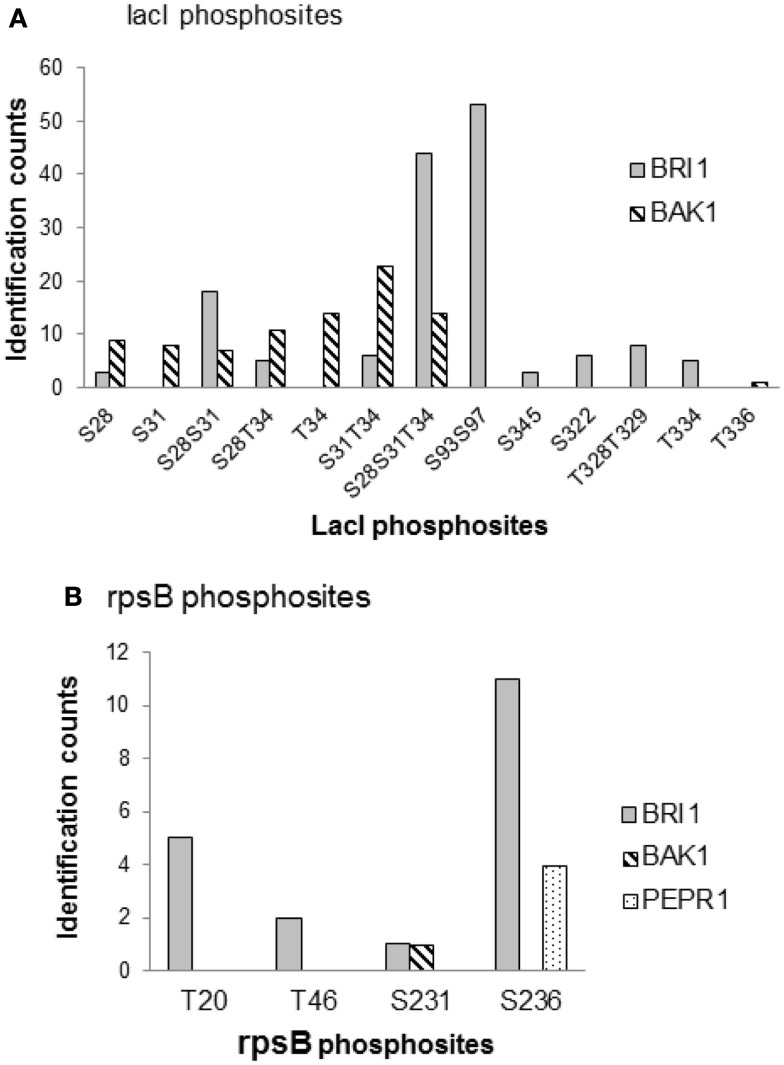
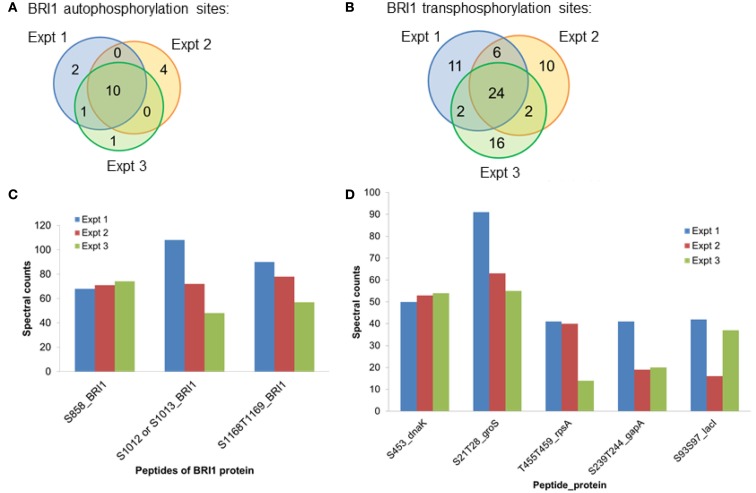
Protein kinase specificity is of fundamental importance to pathway regulation and signal transduction. Here, we report a convenient system to monitor the activity and specificity of recombinant protein kinases expressed in E. coli. We apply this to the study of the cytoplasmic domain of the plant receptor kinase BRASSINOSTEROID-INSENSITIVE 1 (BRI1), which functions in brassinosteroid (BR) signaling. Recombinant BRI1 is catalytically active and both autophosphorylates and transphosphorylates E. coli proteins in situ. Using enrichment approaches followed by LC-MS/MS, phosphosites were identified allowing motifs associated with auto- and transphosphorylation to be characterized. Four lines of evidence suggest that transphosphorylation of E. coli proteins by BRI1 is specific and therefore provides meaningful results: (1) phosphorylation is not correlated with bacterial protein abundance; (2) phosphosite stoichiometry, estimated by spectral counting, is also not related to protein abundance; (3) a transphosphorylation motif emerged with strong preference for basic residues both N- and C-terminal to the phosphosites; and (4) other protein kinases (BAK1, PEPR1, FLS2, and CDPKβ) phosphorylated a distinct set of E. coli proteins and phosphosites. The E. coli transphosphorylation assay can be applied broadly to protein kinases and provides a convenient and powerful system to elucidate kinase specificity.

Keywords: BAK1; BRI1; CDPK; FLS2; PEPR1; phosphorylation motif.


Figures

Figure 1
Figure 1
The E. coli proteins transphosphorylated by BRI1 covered a broad range in protein abundance. (A) Relative abundance of 62 of the 73 E. coli proteins transphosphorylated by BRI1 in situ. Blue diamonds are emPAI-derived copy number per cell (Ishihama et al., 2008) and red circles are values based on fluorescence measurements (Taniguchi et al., 2010) and the corresponding protein names are indicated on the top of the figure. The identity of the proteins quantified by emPAI method were: (1) rplV; (2) rpmD; (3) rplX; (4) crr; (5) rpsA; (6) ahpC; (7) gapA; (8) rpsB; (9) hupB; (10) rpsD; (11) fugA; (12) rpsC; (13) rplC; (14) tsf; (15) rplM; (16) hupA; (17) rpsL; (18) rpmE; (19) rpsE; (20) rplO; (21) rplE; (22) rpsM; (23) tig; (24) dnaK; (25) rpsF; (26) rplN; (27) rplJ; (28) grpE; (29) rpmA; (30) frr; (31) rpsJ; (32) rplK; (33) rpsl; (34) cspA; (35) rpsK; (36) sucB; (37) rpoA; (38) groS; (39) pnp; (40) rho; (41) rpoC; (42) juaA; (43) typA; (44) ybeD; (45) infB; (46) sucD; (47) pta; (48) ihfB; (49) yqjD; (50) rpoD; (51) ihfA; (52) aspA; (53) hslU; (54) ftsZ; (55) gatZ; (56) dnaJ; (57) accD; (58) lipA; (59) gatD; (60) tatA; (61) parB; (62) FimD. (B) Abundance of specific phosphopeptides, derived from E. coli proteins transphosphorylated by BRI1 in situ, was not related to the abundance of the parent protein. The spectral counts were the sum of four independent experiments, two with TiO2 enrichment and two with IMAC (Fe2+) enrichment. The phosphopeptides with top spectral counts are annotated in the graph.
Figure 2
Figure 2
Characterization of BRI1 transphosphorylationsubstrates in E. coli. (A) The E. coli proteins phosphorylated by BRI1 in situ function in diverse biological pathways. (B) pLogo motif analysis of BRI1 transphosphorylation (upper panel) and autophosphorylation (lower panel) sites in E. coli separated according to serine and threonine sites. The number of sites analyzed is indicated in each panel. The phosphorylated residue is annotated as position 0, and the six upstream or downstream residues are annotated as −6 to −1 and +1 to +6, respectively. Residues above the x-axis are overrepresented, relative to their statistical significance in the context of the entire E. coli proteome, while residues below the x-axis are underrepresented. The red line corresponds to a p-value of 0.05. (C) The distribution of the BRI1 transphosphorylation sites in protein secondary structure. (D) The distribution of BRI1 transphosphorylation sites normalized for the total number of serine or threonine residues in a given secondary structure in the E. coli proteome.
Figure 3
Figure 3
pLogo motif analysis of BRI1 phospho substrates in E. coli. The substrates were categorized as their identity of Ser or Thr residues, and their localization in the protein secondary structure. The corresponding background database in E. coli proteome was used. The results revealed the distinct motif of loop substrates versus helix and strand substrates targeted by BRI1.
Figure 4
Figure 4
Transphosphorylation of E. coli proteins by the protein kinases tested in the present study. (A) ProQ diamond stained blot showing the increase of overall phosphorylation of E. coli proteins, when exogenous kinases were expressed. LRK non-RD-type kinase FLS2, BRI1 kinase dead mBRI1 (K911E), and the non-kinase protein 14−3−3ω were used as controls. In addition to RLK RD kinases (BRI1, BAK1, and PEPR1), kinase CDPKβ was also found with considerable increase in E. coli phosphorylation, when a 1 mM Ca2+ was added to E. coli growth culture. (B) Anti-pThr immunoblots confirmed the phospho bands identified by ProQ.
Figure 5
Figure 5
Comparison of transphosphorylation of E. coli proteins for BRI1, BAK1, PEPR1, and CDPKβ. (A) Venn diagram illustrating the overlap in phosphopeptides and (B) phosphoproteins identified as substrates of the four kinases expressed individually in E. coli. (C) Number of phosphosites per protein that were identified following expression of the protein kinases.
Figure 6
Figure 6
Motif analysis for BAK1, PEPR1, and CDPKβ transphosphorylation of E. coli proteins. pLogo motif analysis of transphosphorylation on serine (left panels) and threonine (right panels) sites in E. coli. The number of sites analyzed is indicated in each panel. The phosphorylated residue is annotated as position 0, and the six upstream or downstream residues are annotated as −6 to −1 and +1 to +6, respectively. Residues above the x-axis are overrepresented, relative to their statistical significance in the context of the entire E. coli proteome, while residues below the x-axis are underrepresented. The red line corresponds to a p-value of 0.05.
Figure 7
Figure 7
Comparison of kinase specificities for BRI1, BAK1, and PEPR1 with lactose operon repressor (lacI) or 30S ribosomal protein S2 (rpsB) as substrate. (A) Abundance of specific phosphopeptides of lacI and (B) ribosomal protein rpsB that were transphosphorylated by the indicated protein kinases expressed in E. coli cells. The relative abundance of each phosphopeptide species was based on the spectral counts in the mass spectrometry identification, and reflects the sum of four independent experiments involving two TiO2 and two IMAC (Fe2+) enrichment steps. Note that there was no evidence for phosphorylation of lacI by PEPR1, or rpsB by PEPR1 or CDPKβ, and that phosphopeptides are identified using the single letter abbreviations for Ser (S) and Thr (T).
Figure 8
Figure 8
The reproducibility of the proteomics analysis in this study. Three biological replicates of BRI1 auto- and transphosphorylated E. coli cells were digested with trypsin. Phosphopeptides were enriched with the TiO2 method, before identification with data-dependent analysis in the mass spectrometry. (A) Venn diagram showing the overlap of the identified BRI1 autophosphorylation peptides from three biological replicates. Ten abundant BRI1 autophosphorylation peptides were commonly identified. (B) Venn diagram showing the overlap of the identified BRI1 transphosphorylation peptides from three biological replicates. Twenty-four abundant BRI1 transphosphorylation peptides were commonly identified. (C) The reproducibility of spectral counts of three most abundant BRI1 autophosphorylation peptides using TiO2 enrichment. (D) The reproducibility of spectral counts on the five most abundant BRI1 transphosphorylation peptides using TiO2 enrichment. Note that phosphopeptides are identified using the single letter abbreviations for Ser (S) and Thr (T).

Similar articles

Cited by

References

    1. Bornancin F., Parker P. J. (1996). Phosphorylation of threonine 638 critically controls the dephosphorylation and inactivation of protein kinase C. Curr. Biol. 6, 1114–112310.1016/S0960-9822(02)70678-7 - DOI - PubMed
    1. Cheng S. H., Willmann M. R., Chen H. C., Sheen J. (2002). Calcium signaling through protein kinases. The Arabidopsis calcium-dependent protein kinase gene family. Plant Physiol. 129, 469–48510.1016/S0960-9822(02)70678-7 - DOI - PMC - PubMed
    1. Chevalier D., Walker J. C. (2005). Functional genomics of protein kinases in plants. Brief. Funct. Genomic Proteomic 3, 362–37110.1104/pp.005645 - DOI - PubMed
    1. Chiang C. W. K., Derti A., Schwartz D., Chou M. F., Hirschhorn J. N., Wu C. T. (2008). Ultraconserved elements: analyses of dosage sensitivity, motifs and boundaries. Genetics 180, 2277–229310.1093/bfgp/3.4.362 - DOI - PMC - PubMed
    1. Chinchilla D., Zipfel C., Robatzek S., Kemmerling B., Nurnberger T., Jones J. D. G., et al. (2007). A flagellin-induced complex of the receptor FLS2 and BAK1 initiates plant defence. Nature 448, 497–50010.1534/genetics.108.096537 - DOI - PubMed

LinkOut - more resources