

Differences between adiposity indicators for predicting all-cause mortality in a representative sample of United States non-elderly adults
- PMID: 23226283
- PMCID: PMC3511554
- DOI: 10.1371/journal.pone.0050428
Differences between adiposity indicators for predicting all-cause mortality in a representative sample of United States non-elderly adults
Abstract
Background: Adiposity predicts health outcomes, but this relationship could depend on population characteristics and adiposity indicator employed. In a representative sample of 11,437 US adults (National Health and Nutrition Examination Survey, 1988-1994, ages 18-64) we estimated associations with all-cause mortality for body mass index (BMI) and four abdominal adiposity indicators (waist circumference [WC], waist-to-height ratio [WHtR], waist-to-hip ratio [WHR], and waist-to-thigh ratio [WTR]). In a fasting subsample we considered the lipid accumulation product (LAP; [WC enlargement*triglycerides]).
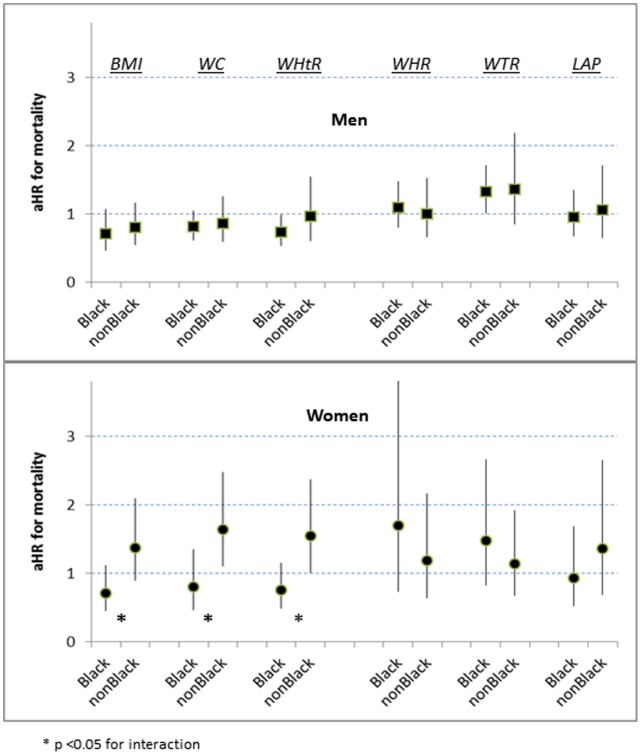
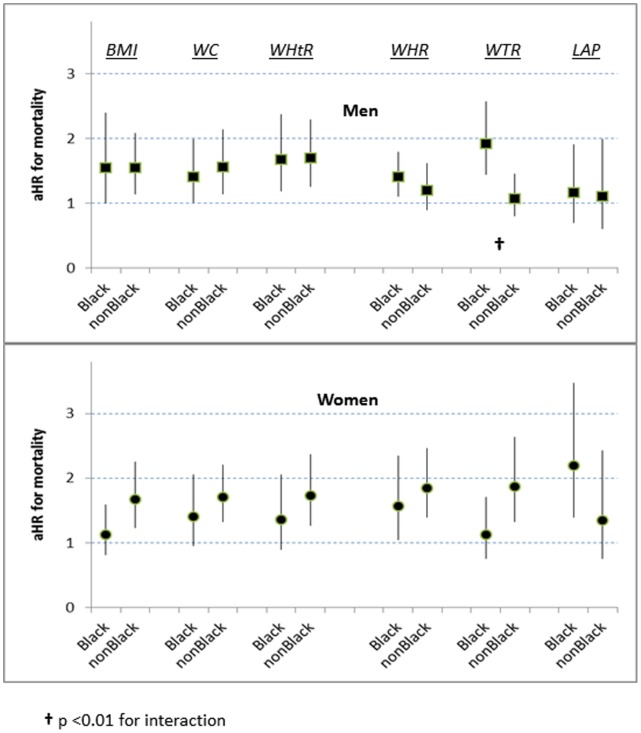
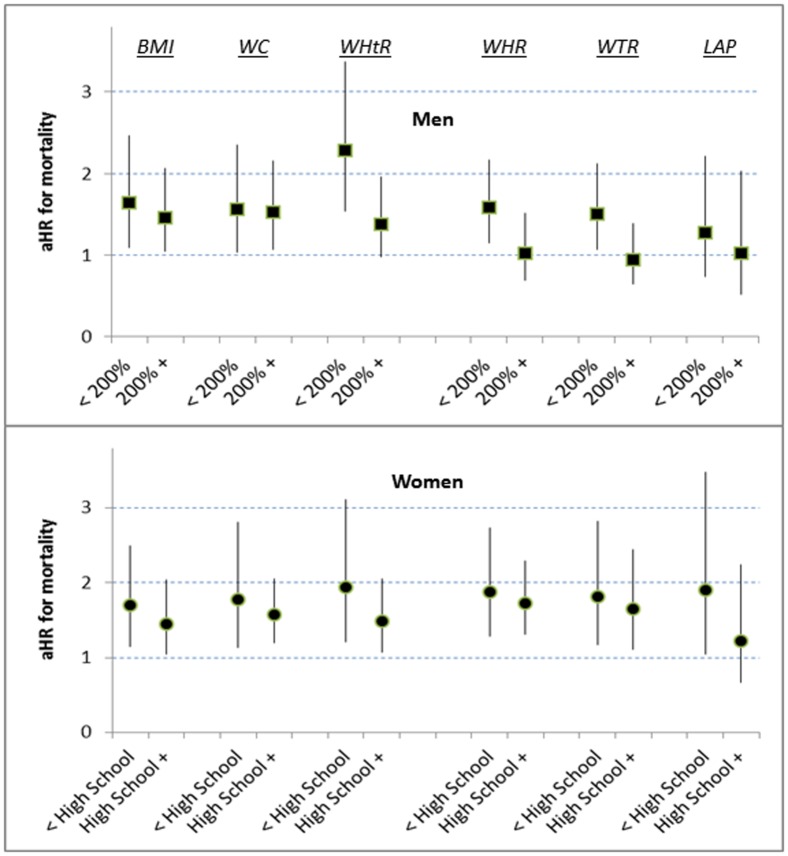
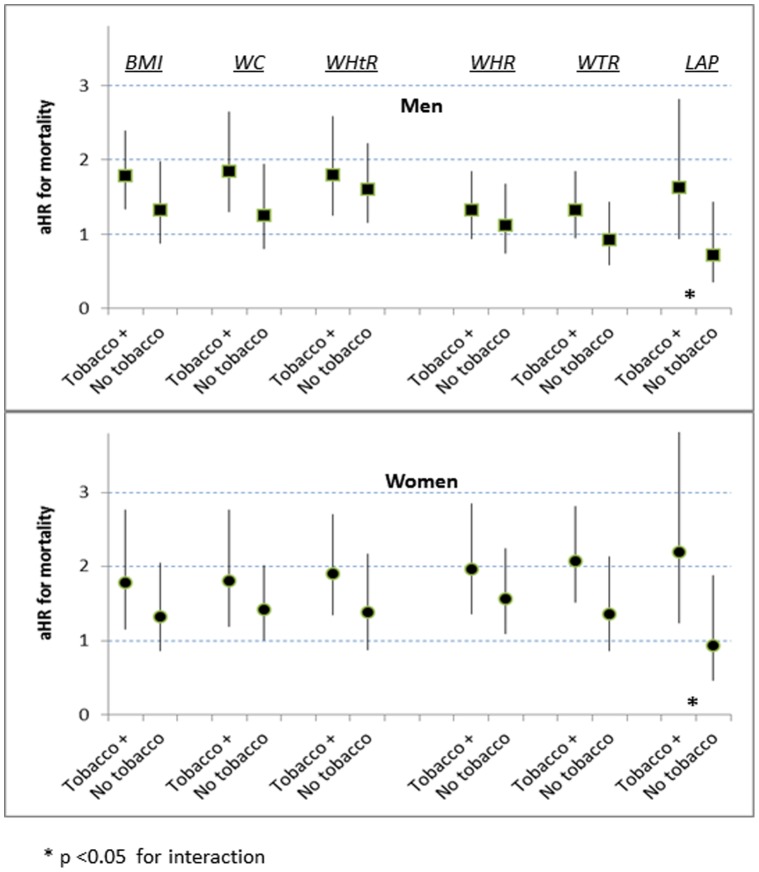
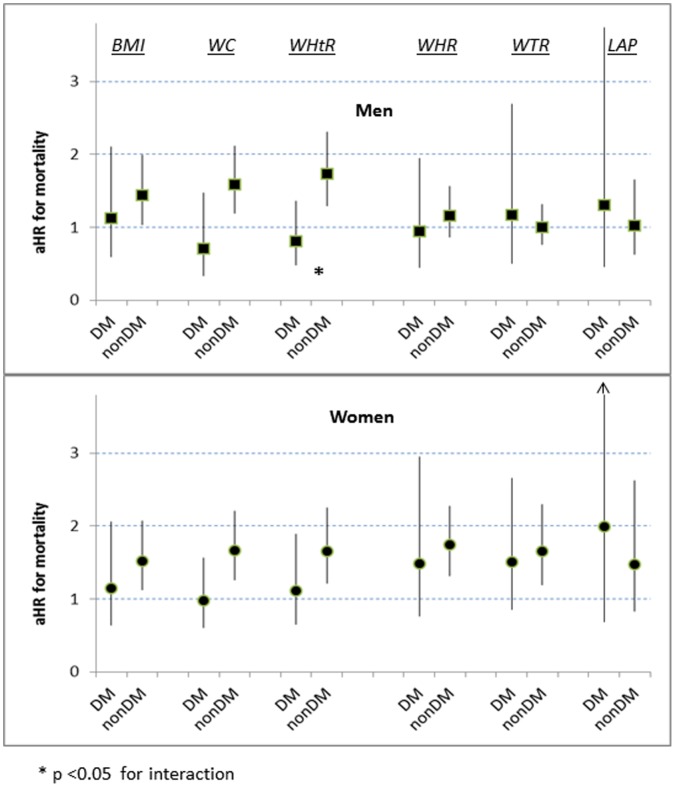
Methods and findings: For each adiposity indicator we estimated linear and categorical mortality risks using sex-specific, proportional-hazards models adjusted for age, black ancestry, tobacco exposure, and socioeconomic position. There were 1,081 deaths through 2006. Using linear models we found little difference among indicators (adjusted hazard ratios [aHRs] per SD increase 1.2-1.4 for men, 1.3-1.5 for women). Using categorical models, men in adiposity midrange (quartiles 2+3; compared to quartile 1) were not at significantly increased risk (aHRs<1.1) unless assessed by WTR (aHR 1.4 [95%CI 1.0-1.9]). Women in adiposity midrange, however, tended toward elevated risk (aHRs 1.2-1.5), except for black women assessed by BMI, WC or WHtR (aHRs 0.7-0.8). Men or women in adiposity quartile 4 (compared to midrange) were generally at risk (aHRs>1.1), especially black men assessed by WTR (aHR 1.9 [1.4-2.6]) and black women by LAP (aHR 2.2 [1.4-3.5]). Quartile 4 of WC or WHtR carried no significant risk for diabetic persons (aHRs 0.7-1.1), but elevated risks for those without diabetes (aHRs>1.5). For both sexes, quartile 4 of LAP carried increased risks for tobacco-exposed persons (aHRs>1.6) but not for non-exposed (aHRs<1.0).
Conclusions: Predictions of mortality risk associated with top-quartile adiposity vary with the indicator used, sex, ancestry, and other characteristics. Interpretations of adiposity should consider how variation in the physiology and expandability of regional adipose-tissue depots impacts health.
Conflict of interest statement
Figures
References
-
- World Health Organization Expert Committee on Physical Status (1995) Physical Status: The Use and Interpretation of Anthropometry - Report of a WHO Expert Committee. Geneva: WHO technical report series; 854. Available: http://helid.digicollection.org/en/d/Jh0211e/#Jh0211e. Accessed 30 March 2012. - PubMed
-
- Dulloo AG, Jacquet J, Solinas G, Montani JP, Schutz Y (2010) Body composition phenotypes in pathways to obesity and the metabolic syndrome. Int J Obes 34: S4–S17. - PubMed
-
- Cornier MA, Despres JP, Davis N, Grossniklaus DA, Klein S, et al. (2011) Assessing adiposity: A scientific statement from the American Heart Association. Circulation 124: 1996–2019. - PubMed
-
- National Center for Health Statistics - Office of Analysis and Epidemiology (1994) Plan and Operation of the Third National Health and Nutrition Examination Survey, 1988–1994. Hyattsville, MD. Available: http://www.cdc.gov/nchs/data/series/sr_01/sr01_032.pdf. Accessed 30 March 2012.
-
- Hahn RA, Truman BI, Barker ND (1996) Identifying ancestry: The reliability of ancestral identification in the United States by self, proxy, interviewer, and funeral director. Epidemiology 7: 75–80. - PubMed
MeSH terms
LinkOut - more resources
Full Text Sources
Medical
Research Materials
