

Vaccination rates among the general adult population and high-risk groups in the United States
- PMID: 23226312
- PMCID: PMC3511565
- DOI: 10.1371/journal.pone.0050553
Vaccination rates among the general adult population and high-risk groups in the United States
Abstract
Background: In order to adequately assess the effectiveness of vaccination in helping to control vaccine-preventable infectious disease, it is important to identify the adherence and uptake of risk-based recommendations.
Methods: The current project includes data from five consecutive datasets of the National Health and Wellness Survey (NHWS): 2007 through 2011. The NHWS is an annual, Internet-based health questionnaire, administered to a nationwide sample of adults (aged 18 or older) which included items on vaccination history as well as high-risk group status. Vaccination rates and characteristics of vaccinees were reported descriptively. Logistic regressions were conducted to predict vaccination behavior from sociodemographics and risk-related variables.
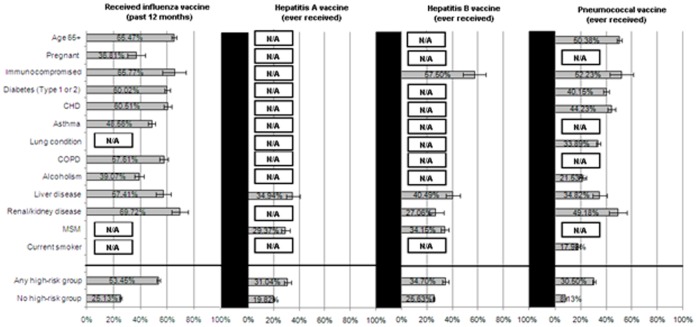
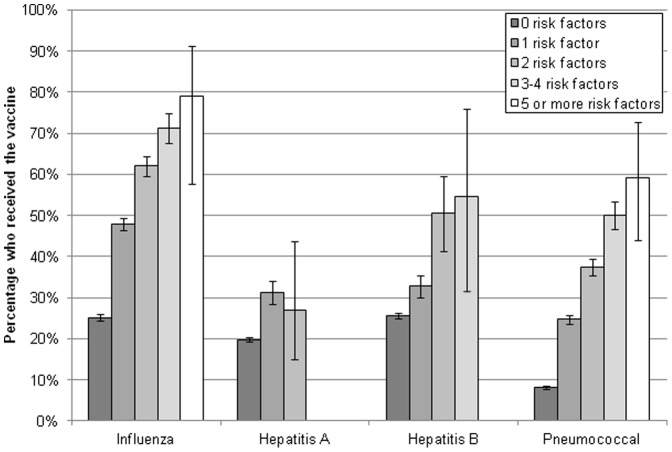
Results: The influenza vaccination rate for all adults 18 years and older has increased significantly from 28.0% to 36.2% from 2007 to 2011 (ps<.05). Compared with those not at high risk (25.1%), all high-risk groups were vaccinated at a higher rate, from 36.8% (pregnant women) to 69.7% (those with renal/kidney disease); however, considerable variability among high-risk groups was observed. Vaccination rates among high-risk groups for other vaccines varied considerably though all were below 50%, with the exception of immunocompromised respondents (57.5% for the hepatitis B vaccine and 52.5% for the pneumococcal vaccine) and the elderly (50.4% for the pneumococcal). Multiple risk factors were associated with increased rate of vaccination for most vaccines. Significant racial/ethnic differences with influenza, hepatitis, and herpes zoster vaccination rates were also observed (ps<.05).
Conclusions: Rates of influenza vaccination have increased over time. Rates varied by high-risk status, demographics, and vaccine. There was a pattern of modest vaccination rate increases for individuals with multiple risk factors. However, there were relatively low rates of vaccination for most risk-based recommendations and all fell below national goals.
Conflict of interest statement
Figures
References
-
- Centers for Disease Control and Prevention (CDC) (2011) Recommended adult immunization schedule – United States, 2011. MMWR 60: 1–4. - PubMed
-
- Lu P, Bridges CB, Euler GL, Singleton JA (2008) Influenza vaccination of recommended adult populations, U.S., 1989–2005. Vaccine 26: 1786–1793. - PubMed
-
- Lu P, Singleton JA, Rangel MC, Wortley PM, Bridges CB (2005) Influenza vaccination trends among adults 65 years or older in the United States, 1989–2002. Arch Intern Med 165: 1849–1856. - PubMed
-
- Centers for Disease Control and Prevention (CDC) (2005) Influenza vaccination levels among persons aged >65 years and among persons aged 18–64 years with high-risk conditions – United States, 2003. MMWR 54: 1045–1049. - PubMed
Publication types
MeSH terms
Substances
LinkOut - more resources
Full Text Sources
Medical
