. 2012;7(11):e50575.
doi: 10.1371/journal.pone.0050575. Epub 2012 Nov 30.

Non-invasive imaging of endothelial progenitor cells in tumor neovascularization using a novel dual-modality paramagnetic/near-infrared fluorescence probe

Affiliations

Non-invasive imaging of endothelial progenitor cells in tumor neovascularization using a novel dual-modality paramagnetic/near-infrared fluorescence probe

Xin-Yi Wang et al. PLoS One. 2012.

Abstract

Objective: Bone-marrow derived endothelial progenitor cells (EPCs) play an important role in tumor neovasculature. Due to their tumor homing property, EPCs are regarded as promising targeted vectors for delivering therapeutic agents in cancer treatment. Consequently, non-invasive confirmation of targeted delivery via imaging is urgently needed. This study shows the development and application of a novel dual-modality probe for in vivo non-invasively tracking of the migration, homing and differentiation of EPCs.

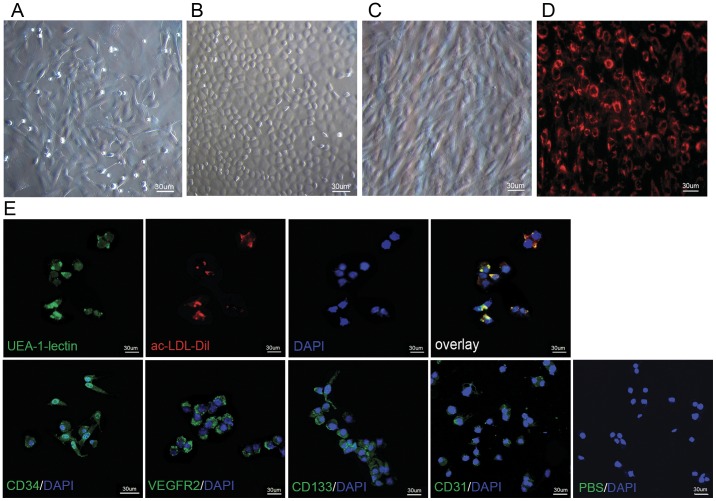
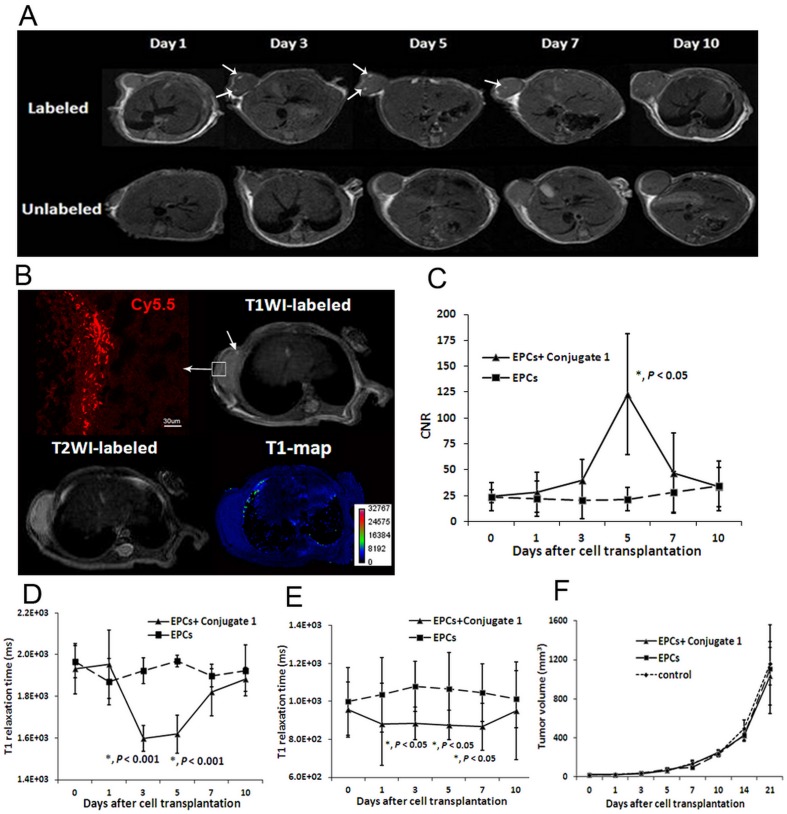
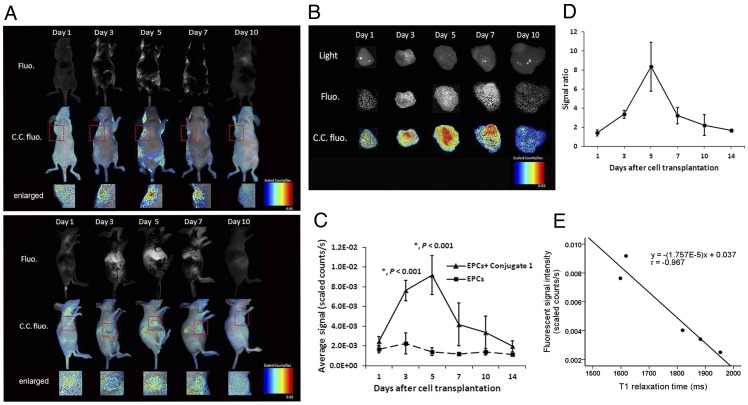
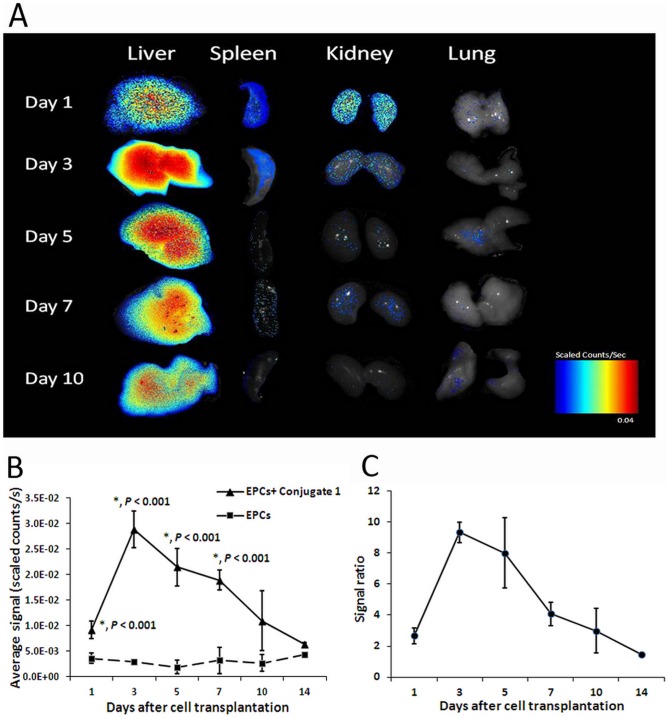
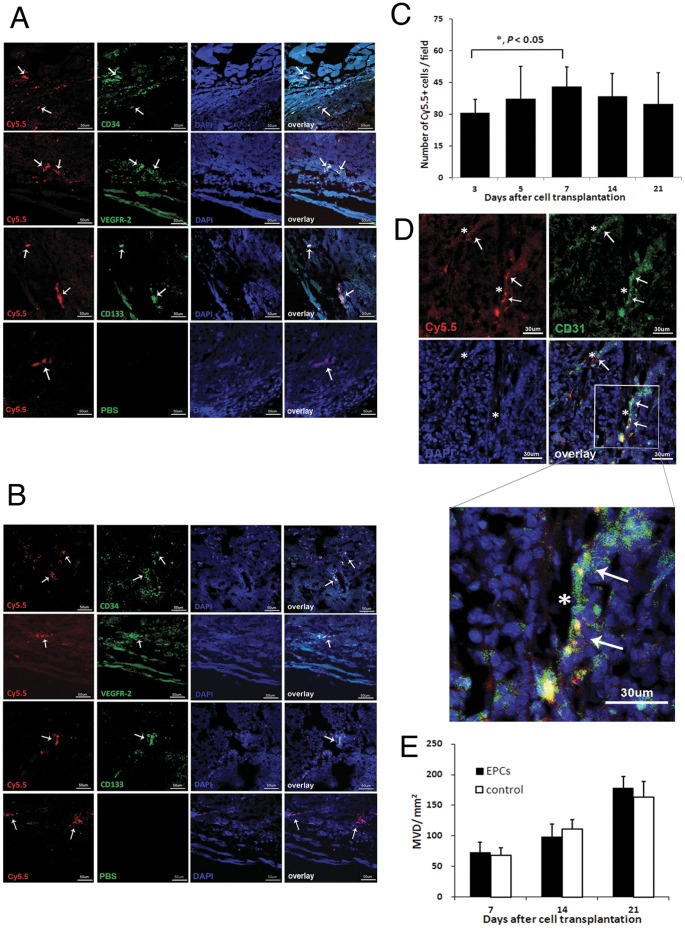
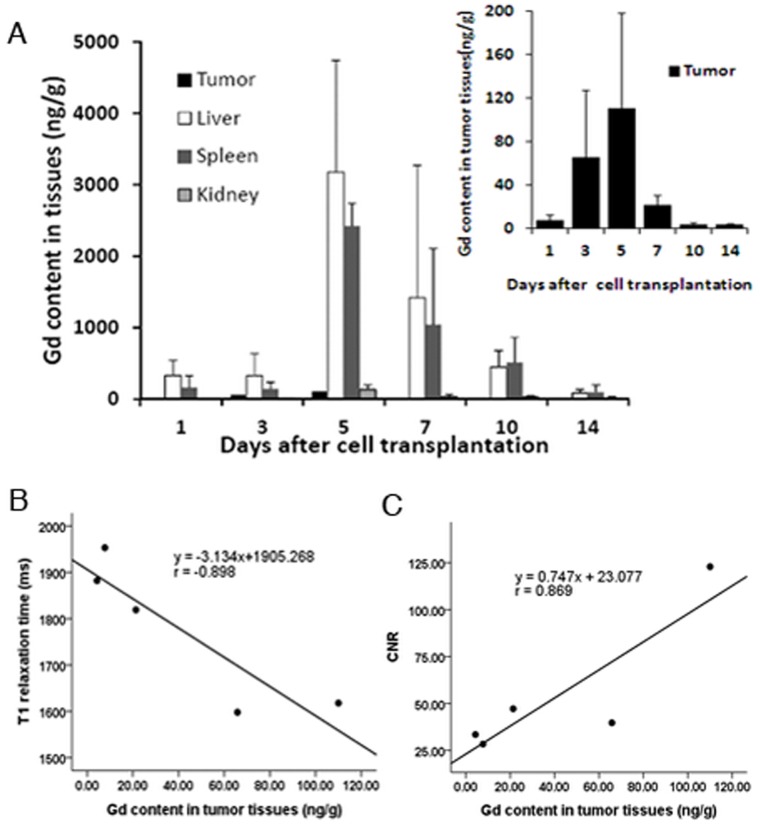
Methods: The paramagnetic/near-infrared fluorescence probe Conjugate 1 labeled EPCs were systemically transplanted into mice bearing human breast MDA-MB-231 tumor xenografts. Magnetic resonance imaging (MRI) and near-infrared (NIR) fluorescence optical imaging were performed at different stages of tumor development. The homing of EPCs and the tumor neovascularization were further evaluated by immunofluorescence.

Results: Conjugate 1 labeled EPCs can be monitored in vivo by MRI and NIR fluorescence optical imaging without altering tumor growth for up to three weeks after the systemic transplantation. Histopathological examination confirmed that EPCs were recruited into the tumor bed and then incorporated into new vessels two weeks after the transplantation. Tumor size and microvessel density was not influenced by EPCs transplantation in the first three weeks.

Conclusions: This preclinical study shows the feasibility of using a MRI and NIR fluorescence optical imaging detectable probe to non-invasively monitor transplanted EPCs and also provides strong evidence that EPCs are involved in the development of endothelial cells during the tumor neovascularization.


Conflict of interest statement

Competing Interests: The authors have declared that no competing interests exist.

Figures

Figure 1
Figure 1. Cellular morphology of cultured EPCs.
(A) The adherent cells showed irregular shape and began to form clusters 5 days after incubation. (B) A typical “cobblestone” appearance which is the characteristics of an endothelial cell monolayer was found at day 10. (C) Cells passaged 3 times at a ratio of 1∶2 with an average of 7 days of growth showed homogenous spindle shaped morphology. (D) Fluorescence microscopy revealed the uptake of Conjugate 1 by adherent cells with positive rhodamine signals. (E) These cells were stained positively with FITC-UEA I, DiI-Ac-LDL and other endothelial progenitor cell markers, and showed low expression of endothelial cell marker CD31.
Figure 2
Figure 2. MRI exams demonstrated the homing of labeled EPCs into tumors.
(A) Sprinkles of hyperintense region at the margin of the tumor (arrows) on T1-weighted images indicate the presence of Conjugate 1 labeled EPCs in the tumor as early as 3 days after transplantation. Significant hyperintense areas within the tumor were also observed at day 5 and day 7. (B) A representative T1-weighted image, T2-weighted image and pseudo-color T1 map obtained at day 5. Images of fluorescent microscopy showed that Cy5.5 positive cells were found at the corresponding areas of high signal intensity (arrows) on T1-weighted images. Scale bar = 30 µm (C) The CNR from the region of interest of group 1 reached the maximum at day 5. The difference between group 1 and 2 in CNR was statistically significant (p<0.05, n = 3). (D) Coinciding with the signal enhancement detected from T1-weighted images, intratumoral T1 relaxation time initially decreased to (1.60±0.06)×103 ms at day 3 and persisted at (1.62±0.09)×103 ms until day 5. The mean value recovered to the base line two days later. The significant decrease of T1 relaxation time (p<0.001, n = 3) confirmed the homing property of transplanted EPCs. (E) Although the accumulation of Conjugate 1 labeled EPCs in the liver did not induce significant contrast enhancement, a significant decrease of hepatic T1 relaxation time was observed from day 3 to day 7 (p<0.05, n = 3). (F) During the three weeks of monitoring period, no significant difference in tumor volume was found between each group at each time point (p>0.05, n = 3).
Figure 3
Figure 3. Enhancement of fluorescence intensity at the tumor area in optical imaging.
(A) Near infrared fluorescence images and color-coded fluorescence images of decubitus and lateral position of a mouse post transplantation show peak signal intensity appeared at day 5 (Fluo, fluorescence; C.C. fluo, color-coded fluorescence). (B) A strong Cy5.5 fluorescence emission was detected in the tumor tissue 5 days after EPC transplantation and remained until day 7. (C) The peak value of average fluorescent signal intensity was measured at day 5 with (9. 18±1.98)×10−3 scaled counts/s. Signal intensity changes from day 3 to day 5 in group 1 were statistically significant (p<0.001, n = 3). (D) The signal ratio of tumors (signal ratio was calculated as signal intensities of the tumor with labeled EPCs over the control tumor with unlabeled EPCs) reached the maximum of 8.34±2.55 at day 5. (E) A linear correlation between averaged fluorescent signal intensity and intratumoral T1 relaxation time was observed (r = −0.967, p<0.01).
Figure 4
Figure 4. Ex vivo NIR imaging of other organs.
(A) Color-coded fluorescence images indicated that strong signal enhancement in the liver persisted from day 3 to day 7. Weak signals were detected from other organs at day 1 and 3. (B) The levels of liver signal intensity of group 1 and 2 were shown. Significant fluorescence intensity differences in the liver between group 1 and 2 were observed from day 1 to day 7 (p<0.001, n = 3). The peak value was detected at day 3. (C) The liver signal ratio between group 1 and 2 was 9.34±0.68 at 3 days post transplantation of EPCs.
Figure 5
Figure 5. Histopathological examinations.
Histopathological examinations were performed to validate imaging results. (A) Cy5.5 and anti-rat endothelial progenitor cell antibody positive cells (arrow) were observed in the connective tissue or at the tumor margin at day 3. Scale bar = 50 µm. In contrast, no Alex Fluo 488 signal was observed in the control group. (B) Sections collected at day 7 showed significant double positive cells (arrow) inside the tumor. Scale bar = 50 µm. (C) The numbers of Cy5.5 positive cells increased in tumors (30.75±6.24 cells/field of view at day 3 vs. 43.13±9.17 cells/field of view at day 7, p<0.05, n = 15), but remained the same afterwards. (D) CD31 and Cy5.5 double positive cells (arrow) were observed at the vessel walls inside the tumor at the day 14 (asterisk represent the lumen). Scale bar = 30 µm. (E) CD31 positive microvessels were counted in MVD quantification at 7, 14 and 21 days after cell transplantation. Compared to the control, no significant differences were found between the groups (p>0.05, n = 15).
Figure 6
Figure 6. The amount of Gd in each organ.
(A) The levels of Gd in the liver and spleen are much higher than that of tumor tissues; the concentration of Gd in the tumor reached peak at day 5. (B) A linear correlation (r = −0.898, p<0.05) was found between the averaged Gd content in the tumor and intratumoral T1 relaxation time. (C) The correlation between the averaged Gd content in the tumor and CNR of the tumor was significant (r = 0.869, p<0.05).

References

    1. Folkman J (1971) Tumor angiogenesis: therapeutic implications. N Engl J Med 285: 1182–1186. - PubMed
    1. Janic B, Arbab AS (2010) The role and therapeutic potential of endothelial progenitor cells in tumor neovascularization. ScientificWorldJournal 10: 1088–1099. - PMC - PubMed
    1. Asahara T, Masuda H, Takahashi T, Kalka C, Pastore C, et al. (1999) Bone marrow origin of endothelial progenitor cells responsible for postnatal vasculogenesis in physiological and pathological neovascularization. Circ Res 85: 221–228. - PubMed
    1. Nolan DJ, Ciarrocchi A, Mellick AS, Jaggi JS, Bambino K, et al. (2007) Bone marrow-derived endothelial progenitor cells are a major determinant of nascent tumor neovascularization. Genes Dev 21: 1546–1558. - PMC - PubMed
    1. Lyden D, Hattori K, Dias S, Costa C, Blaikie P, et al. (2001) Impaired recruitment of bone-marrow-derived endothelial and hematopoietic precursor cells blocks tumor angiogenesis and growth. Nat Med 7: 1194–1201. - PubMed

Publication types

MeSH terms