. 2012;7(11):e50591.
doi: 10.1371/journal.pone.0050591. Epub 2012 Nov 30.

Genotoxic agents promote the nuclear accumulation of annexin A2: role of annexin A2 in mitigating DNA damage

Affiliations

Genotoxic agents promote the nuclear accumulation of annexin A2: role of annexin A2 in mitigating DNA damage

Patricia A Madureira et al. PLoS One. 2012.

Abstract

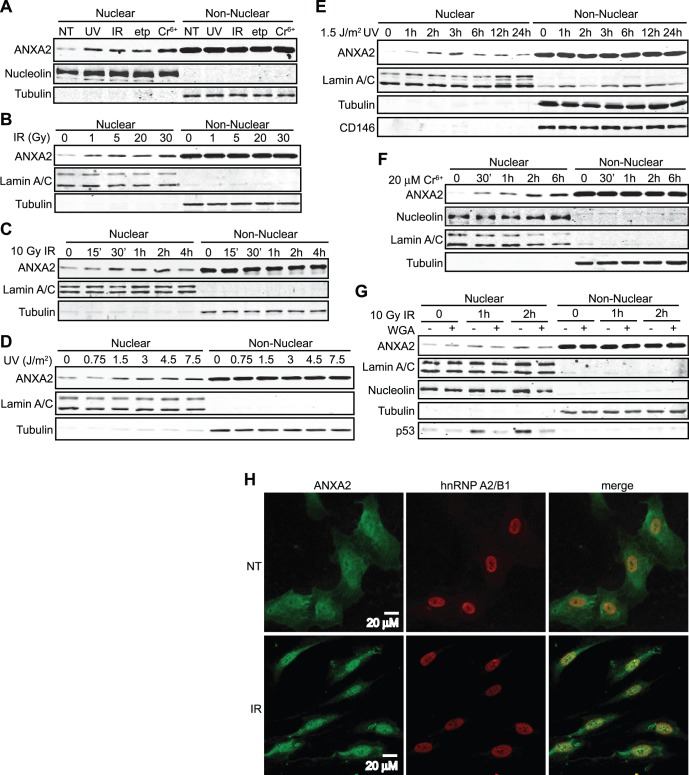
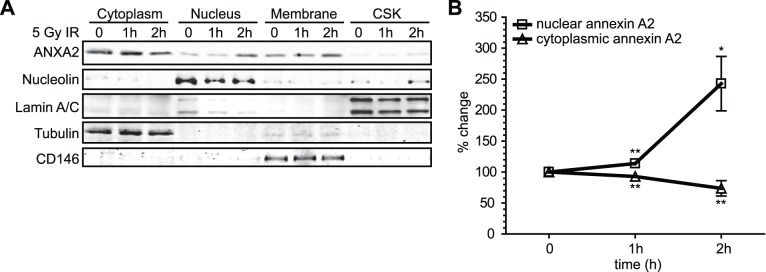
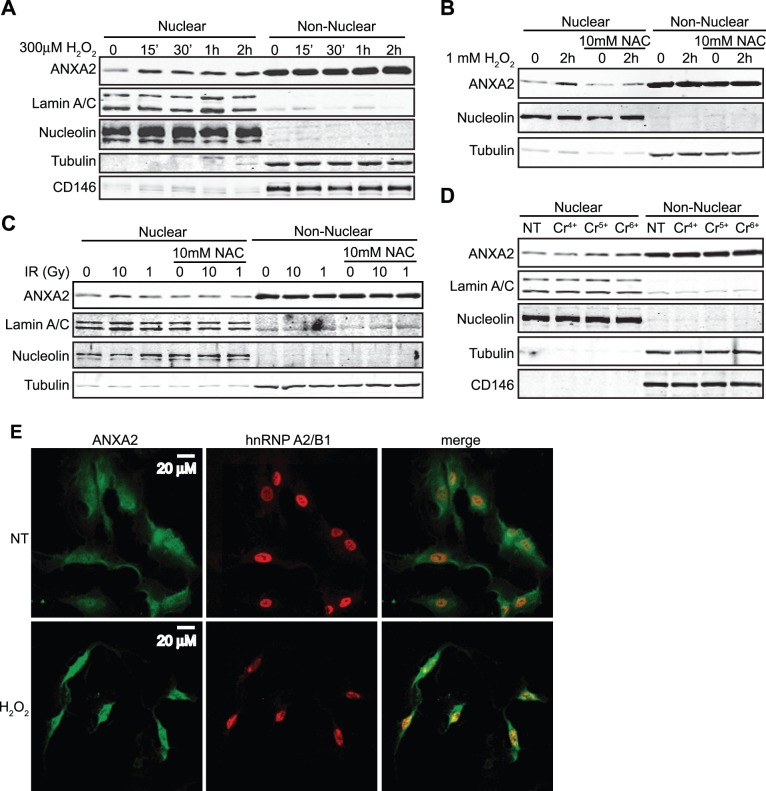
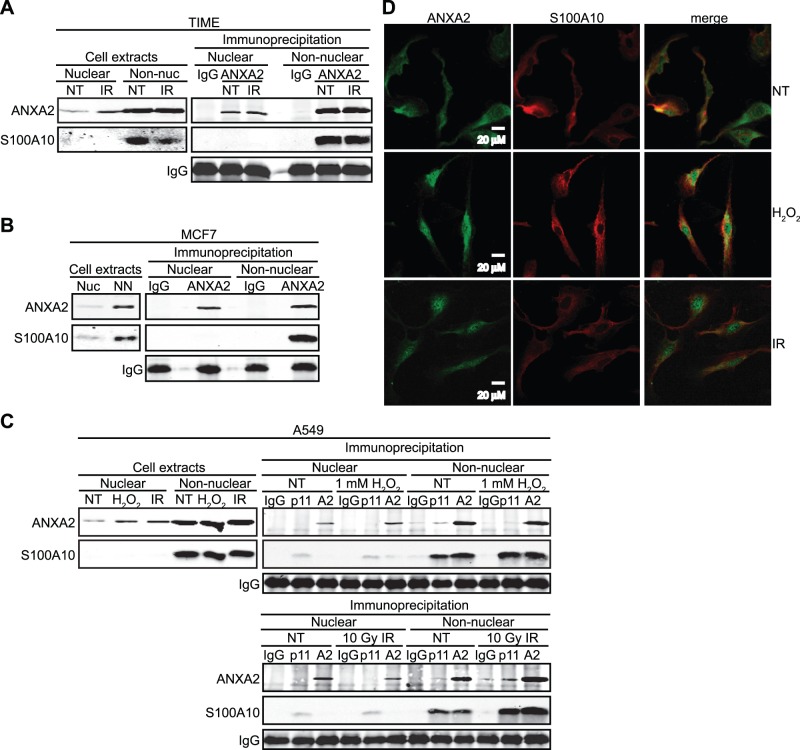
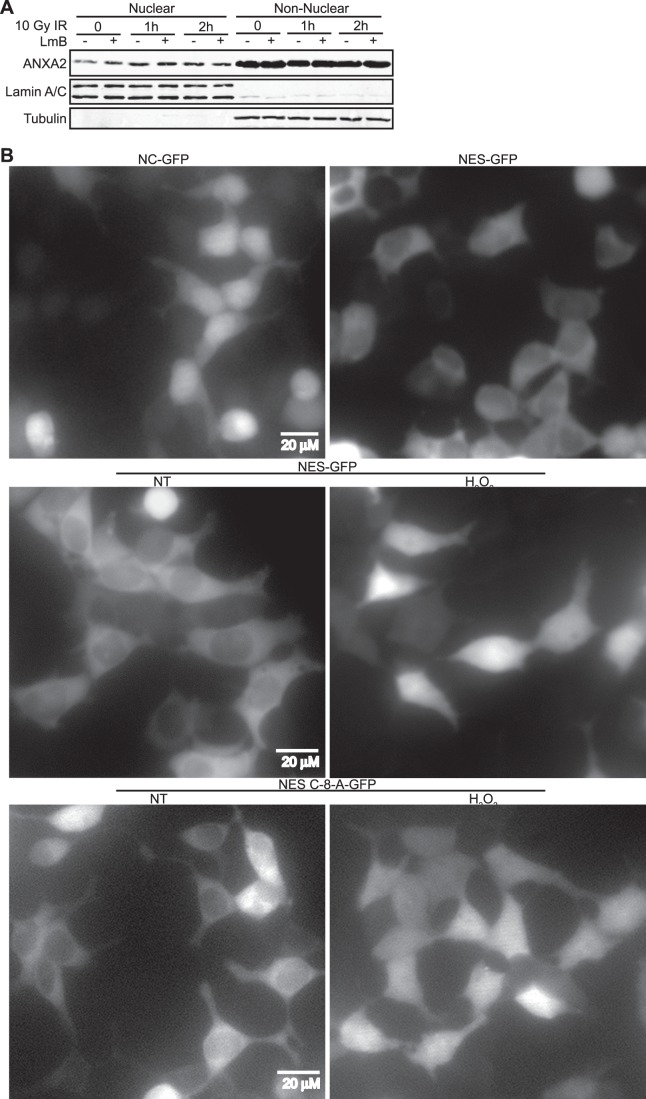
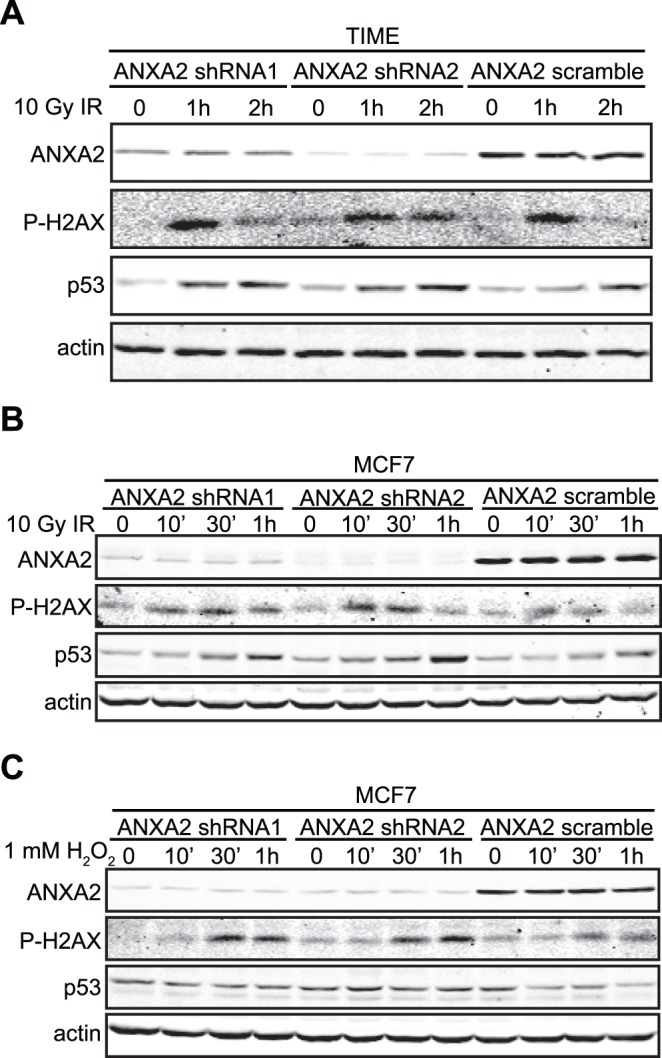
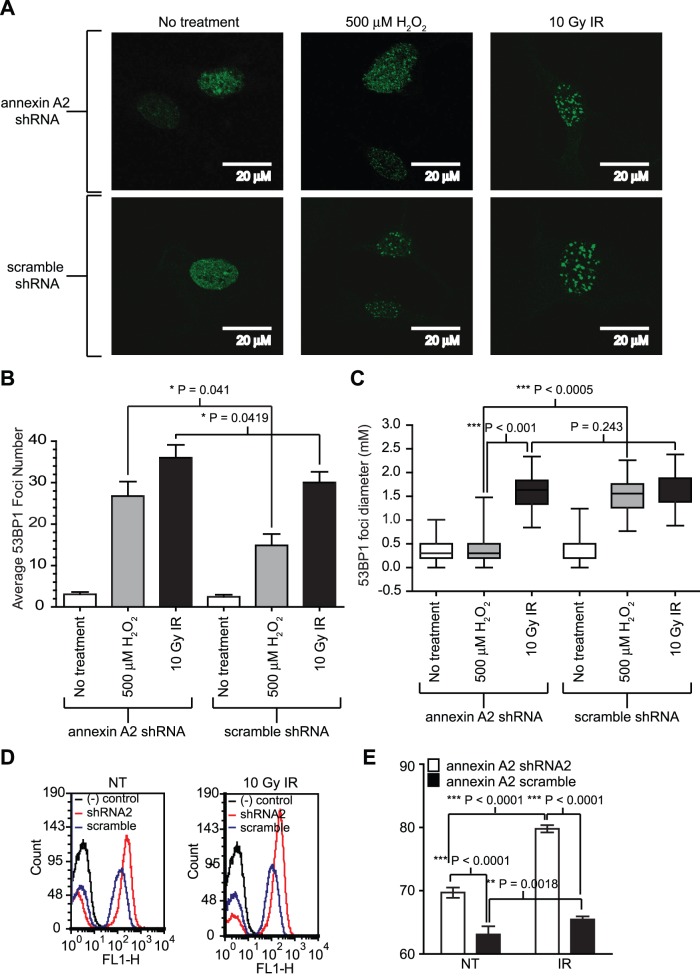
Annexin A2 is an abundant cellular protein that is mainly localized in the cytoplasm and plasma membrane, however a small population has been found in the nucleus, suggesting a nuclear function for the protein. Annexin A2 possesses a nuclear export sequence (NES) and inhibition of the NES is sufficient to cause nuclear accumulation. Here we show that annexin A2 accumulates in the nucleus in response to genotoxic agents including gamma-radiation, UV radiation, etoposide and chromium VI and that this event is mediated by the nuclear export sequence of annexin A2. Nuclear accumulation of annexin A2 is blocked by the antioxidant agent N-acetyl cysteine (NAC) and stimulated by hydrogen peroxide (H₂O₂), suggesting that this is a reactive oxygen species dependent event. In response to genotoxic agents, cells depleted of annexin A2 show enhanced phospho-histone H2AX and p53 levels, increased numbers of p53-binding protein 1 nuclear foci and increased levels of nuclear 8-oxo-2'-deoxyguanine, suggesting that annexin A2 plays a role in protecting DNA from damage. This is the first report showing the nuclear translocation of annexin A2 in response to genotoxic agents and its role in mitigating DNA damage.


Conflict of interest statement

Competing Interests: The authors have declared that no competing interests exist.

Figures

Figure 1
Figure 1. Annexin A2 translocates into the nucleus in response to genotoxic agents.
TIME cells were not treated (NT) or treated with: (A) 1.5 J/m2 UV-A (365 nm) (UV), 10 Gy Gamma-radiation (IR), 8.5 µM etoposide (etp) or 20 µM chromium VI (Cr6+) for 2 hours; (B) with the indicated doses of Gamma-radiation (IR) for 2 hours; (C) with 10 Gy of IR for the times indicated; (D) with the indicated doses of UV-A radiation for 2 hours; (E) with 1.5 J/m2 UV-A (365 nm) for the times indicated; (F) with 20 µM chromium VI (Cr6+) for the times indicated; (G) with 10 Gy of IR in the absence or presence of Wheat Germ Aglutinin (WGA) for the times indicated. (A–G) Nuclear and Non Nuclear fractions were prepared and identical ratios, representing the same percentage of each subcellular fraction were subjected to SDS-PAGE followed by western blotting with the antibodies indicated. Protein markers for the sub-cellular fractions include: nucleolin (nucleus); lamin A/C (nuclear membrane); tubulin (cytoplasm); CD146 (plasma membrane). (H) TIME cells were either not treated (NT) or treated with 10 Gy IR for 1 hour. Cells were subjected to immunocytochemistry analysis with the antibodies indicated and visualized by confocal microscopy. Scale bar is 20 µM.
Figure 2
Figure 2. Annexin A2 accumulates in the nucleus and decreases in the cytoplasm in response to genotoxic agents.
(A) TIME cells were not treated (NT) or treated with 5 Gy IR for the times indicated. Cells were fractionated into nuclear, cytoplasmic, membrane and cytoskeletal (CSK) fractions. Identical ratios of the various protein fractions, representing the same percentage of each subcellular fraction, were subjected to SDS-PAGE followed by western blotting with the antibodies indicated. Protein markers for the sub-cellular fractions include: nucleolin (nucleus/cytoskeleton); lamin A/C (nuclear membrane and cytoskeleton); tubulin (cytoplasm); CD146 (plasma membrane). (B) Quantification of the change in annexin A2 protein expression in the nucleus and cytoplasm before and after IR treatment using the Licor Odyssey software. These results represent the average of 4 independent experiments (N = 4). Statistical significance was defined as *P<0.05, **P<0.002, *** P<0.0001. Results are expressed as the mean ± StDev.
Figure 3
Figure 3. Annexin A2 nuclear accumulation is dependent of ROS.
TIME cells were treated with (A) 300 µM H2O2 for the times indicated; (B) 1 mM H2O2 in the absence or presence of 10 mM NAC for 2 hours; (C) 1 Gy or 10 Gy of IR in the absence or presence of 10 mM NAC for 2 hours; (D) 20 µM Cr4+, Cr5+ or Cr6+ as indicated, for 2 hours. (A-D) Nuclear and non-nuclear fractions were prepared. Identical ratios of the various protein fractions were subjected to SDS-PAGE followed by western blotting with the antibodies indicated. (E) TIME cells were either not treated (NT) or treated with 0.5 mM H2O2 for 30 minutes. Cells were subjected to immunocytochemistry analysis with the antibodies indicated and visualized by confocal microscopy. Scale bar is 20 µM.
Figure 4
Figure 4. Nuclear annexin A2 is not associated with S100A10.
(A) TIME cells were either not treated (NT) or treated with 10 Gy IR for 2 hours; (B) MCF7 cells were treated with 10 Gy IR for 2 hours; (C) A549 cells were either not treated (NT) or treated with 1 mM H2O2 or 10 Gy IR for 2 hours as indicated. (A–C) Nuclear and non-nuclear fractions were prepared followed by immunoprecipitation with the antibodies indicated. Nuclear and non-nuclear fractions (cell extracts) and immunoprecipitates were subjected to SDS-PAGE and analyzed by western blotting with the antibodies indicated. (D) TIME cells were either not treated (NT) or treated with 0.5 mM H2O2 for 30 minutes or 10 Gy IR for 1 hour. Cells were subjected to immunocytochemistry analysis with the antibodies indicated and visualized by confocal microscopy. Scale bar is 20 µM.
Figure 5
Figure 5. Annexin A2 nuclear accumulation is regulated by its NES.
(A) TIME cells were treated with 10 Gy of IR in the absence or presence of 10 ng/ml Leptomycin B (LmB) for the times indicated. Nuclear and non-nuclear fractions were prepared. Identical ratios of the various protein fractions were subjected to SDS-PAGE followed by western blotting with the antibodies indicated. (B) 293T cells were transfected with Non-specific Control-GFP (NC-GFP), NES-GFP or NES-C-8-A-GFP constructs as indicated. 48 hours after transfection cells were either not treated (NT) or treated with H2O2 and the various GFP proteins were visualized by fluorescence microscopy. Scale bar is 20 µM.
Figure 6
Figure 6. Annexin A2 protects cellular DNA from damage.
(A) TIME ANXA2 shRNA1, TIME ANXA2 shRNA2 or TIME ANXA2 scramble cells were treated with 10 Gy IR for the times indicated; (B-C) MCF7 ANXA2 shRNA1, MCF7 ANXA2 shRNA2 or MCF7 ANXA2 scramble cells were treated with (B) 10 Gy IR for the times indicated or (C) 1 mM H2O2 for the times indicated. (A–C) 20 µg of each cell lysate was subjected to SDS-PAGE followed by western blot analysis with the antibodies indicated.
Figure 7
Figure 7. Annexin A2 depleted cells have higher number of 53BP1 foci and enhanced 8-oxy-G upon genotoxic stress compared to control cells.
TIME annexin A2 shRNA2 and scramble (control) cells were plated on microscope cover slips and incubated at 37°C for 24 h. Cells were then treated with either 10 Gy IR or 500 µM H2O2 for 6 hours. Cells were permeabilized and incubated with anti-53BP1 antibody (SCBT, USA) for 1 hour. Subsequently, they were incubated with the appropriate Cy2-conjugated secondary antibody (Molecular Probes, USA) for 30 minutes. 53BP1 foci were visualized at 100× magnification using a Zeiss LSM 510 META - laser scanning confocal microscope. (A) Representative slides for 53BP1 foci staining for each cell line and treatment, as indicated. Scale bar is 20 µM. (B) Average number of 53BP1 foci for each cell line and treatment, as indicated. (C) 53BP1 foci diameter for each cell line and treatment, as indicated. (A–C) For each condition the number of 53BP1 foci was scored within 100 nuclei from triplicate cover slips. For each 53BP1 foci scored, the diameter was measured using the LSM imaging software Zen 2009 light edition. Statistical significance was assessed by two-way ANOVA or the two-tailed Students t-test. Statistical significance was defined as P<0.05. Results are expressed as the mean ± StDev. (D) TIME annexin A2 shRNA2 or control cells were either not treated or treated with 10 Gy IR for 6 hours. Cells were fixed, permeabilized and labeled with 8-oxy-binding-FITC conjugated protein (Argutus Medical), followed by FACS analysis. As a negative control we used TIME cells that were not incubated with 8-oxy-binding-FITC protein in order to establish the background fluorescence; (E) Percentage of 8-oxy-binding-FITC positively labeled cells from (D). Statistical significance was assessed by the two-tailed Students t-test, N = 6. Statistical significance was defined as *P<0.05, **P<0.002, *** P<0.0001. Results are expressed as the mean ± StDev.

Similar articles

Cited by

References

    1. Moss S, Morgan RO (2004) The annexins. Genome Biol 5: 219. - PMC - PubMed
    1. Gerke V, Creutz CE, Moss SE (2005) Annexins: linking Ca2+ signalling to membrane dynamics. Nat Rev Mol Cell Biol 6: 449–461. - PubMed
    1. Waisman DM (1995) Annexin II tetramer: structure and function. Mol Cell Biochem 149–150: 301–322. - PubMed
    1. Jost M, Thiel C, Weber K, Gerke V (1992) Mapping of three unique Ca(2+)-binding sites in human annexin II. Eur J Biochem 207: 923–930. - PubMed
    1. Jost M, Weber K, Gerke V (1994) Annexin II contains two types of Ca(2+)-binding sites. Biochem J 298(Pt 3): 553–559. - PMC - PubMed

Publication types