. 2012;7(12):e49468.
doi: 10.1371/journal.pone.0049468. Epub 2012 Dec 3.

Cell therapy: a safe and efficacious therapeutic treatment for Alzheimer's disease in APP+PS1 mice

Affiliations

Cell therapy: a safe and efficacious therapeutic treatment for Alzheimer's disease in APP+PS1 mice

Neel R Nabar et al. PLoS One. 2012.

Erratum in

Abstract

Previously, our lab was the first to report the use of antigen-sensitized dendritic cells as a vaccine against Alzheimer's disease (AD). In preparation of this vaccine, we sensitized the isolated dendritic cells ex vivo with Aβ peptide, and administered these sensitized dendritic cells as a therapeutic agent. This form of cell therapy has had success in preventing and/or slowing the rate of cognitive decline when administered prior to the appearance of Aβ plaques in PDAPP mice, but has not been tested in 2 × Tg models. Herein, we test the efficacy and safety of this vaccine in halting and reversing Alzheimer's pathology in 9-month-old APP + PS1 mice. The results showed that administration of this vaccine elicits a long-lasting antibody titer, which correlated well with a reduction of Aβ burden upon histological analysis. Cognitive function in transgenic responders to the vaccine was rescued to levels similar to those found in non-transgenic mice, indicating that the vaccine is capable of providing therapeutic benefit in APP+PS1 mice when administered after the onset of AD pathology. The vaccine also shows indications of circumventing past safety problems observed in AD immunotherapy, as Th1 pro-inflammatory cytokines were not elevated after long-term vaccine administration. Moreover, microhemorrhaging and T-cell infiltration into the brain are not observed in any of the treated subjects. All in all, this vaccine has many advantages over contemporary vaccines against Alzheimer's disease, and may lead to a viable treatment for the disease in the future.


Conflict of interest statement

Competing Interests: The authors have declared that no competing interests exist.

Figures

Figure 1
Figure 1. Cytokine response post in vitro antigenic stimulation.
Wild type and mutated Aβ peptides were sensitized to DCs for 5 days: A) Th1 Cytokines B) Th2 Cytokines C) Non-Specific Cytokines D) Comparative Analysis. PDFM was the only peptide to downregulate TNF-α and IFN-γ, while upregulating IL-4.
Figure 2
Figure 2. Antibody titer post vaccination.
A) short term response. Mouse of the Tg PDFM and Non-Tg PDFM groups elicited a significant antibody titer both 10 and 24 days post vaccination, but the Tg control and Tg PWT group did not (P<0.001). The Non-Tg PDFM group was significantly higher than the Tg PDFM group at both time points (P<0.001). B) Long term antibody response. Both groups had positive antibody titers throughout the duration of the experiment. Antibody titers for both groups showed a significantly elevated titer compared to the control at all time points except day 77 (P<0.05). All readings were captured at 450 nm with 1∶1000 diluted samples.
Figure 3
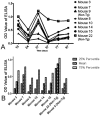
Figure 3. Antibody response of individual mice.
A) Antibody responses on all Tg and select Non-Tg mice are shown. B) The mean and 75th percentile value was used to determine level of antibody response. Mice 8 and 14 did not have a robust, sustained antibody response and were deemed low responders.
Figure 4
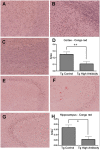
Figure 4. Congo red staining.
A) Non-Tg PDFM Cortex B) Tg Control Cortex C) Tg PDFM Cortex D) Cortex Aβ Burden E) Non-Tg PDFM Hippocampus F) Tg Control Hippocampus G) Tg PDFM Hippocampus H) Hippocampal Aβ Burden. Aβ Burden was significantly decreased in the Tg PDFM group compared to the control group in the Cortex (57.5%) and the Hippocampus (65.9%) (P<0.05). No plaques were observed in Non-Tg mice. All images were captured at 10×magnification.
Figure 5
Figure 5. Blood Aβ.
A) Pre-Treatment (Day 0) vs. Post-Treatment (Day 77). Blood Aβ levels decreased significantly from Day 0 to 77 in both Tg Groups (P<0.05). B) Change in Blood Aβ. Mice of the Tg PDFM group had a greater decrease in Blood Aβ than those of the control group (P<0.01).
Figure 6
Figure 6. Behavioral results.
A) Latency. The Tg PDFM with high antibody titer group performed moderately better than the Tg control group, though not reaching statistical significance. The low-responders performed significantly worse than the Tg Control (P<0.05). B) Error. The Tg PDFM with High Antibody Titer group performed slightly better than the Tg Control Group, though not significant. The low-responders performed significantly worse than the Tg control (P<0.05).
Figure 7
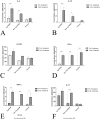
Figure 7. Cytokine expression profile.
A) IL-4 increased in Tg PDFM (P<0.001) and Non-Tg PDFM (P<0.01). B) IL-10 increased in Tg PDFM (P<0.001) and Non-Tg PDFM (P<0.05). C) GSF increased moderately in the PDFM groups, but not the control. D) IFN-γ increased in all three groups (P<0.001) E) TNF-α increased in all three groups (P<0.05). F) IL-17 was elevated in the Non-Tg PDFM group (P<0.001).
Figure 8
Figure 8. Ig Isotyping.
A) Total Ig isotyping. Tg PDFM group showed an increase in IgG1/IgG2a ratio after treatment (P<0.05) B) Aβ Specific isotyping. There was no significant difference in Aβ specific isotyping during the duration of the experiment. Note: Ig isotyping was only done for the Tg PDFM group. Aβ specific Ig isotyping was not able to be done at Day 0, as no Aβ antibody was present.
Figure 9
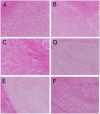
Figure 9. CD3 staining.
A) Non-Tg PDFM Cortex B) Tg Control Cortex C) Tg PDFM Cortex D) Non-Tg PDFM Hippocampus E) Tg Control Hippocampus F) Tg PDFM Hippocampus. Some T-Cell infiltration was observed in the hippocampi of the Tg control group, but not in any treatment groups. All images were captured at 10×magnification.
Figure 10
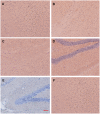
Figure 10. Prussian Blue Staining.
A) Non-Tg PDFM Cortex B) Tg control Cortex C) Tg PDFM Cortex D) Non-Tg PDFM Hippocampus E) Tg Control Hippocampus F) Tg PDFM Hippocampus. No vascular bleeding was observed in any mice of any groups. All images were captured at 10×magnification.
Figure 11
Figure 11. Correlationary analysis.
A) Antibody titer is inversely correlated with Aβ burden (P<0.05) B) Pre-treatment IgG1/IgG2a ratio is inversely correlated with pre-treatment Blood Aβ (P<0.05) C) IgG1/IgG2a ratio is positively correlated with antibody titer (P = 0.19) Stars indicate statistical significance: * P<0.05, ** P<0.01, *** P<0.001.

References

    1. Association As (2012) Alzheimer’s disease facts and figures. Alzheimer’s and Dementia: The Journal of the Alzheimer’s Association. 131–168. - PubMed
    1. Brookmeyer R, Johnson E, Ziegler-Graham K, Arrighi HM (2007) Forecasting the global burden of Alzheimer’s disease. Alzheimers Dement. United States. 186–191. - PubMed
    1. Saxena U (2011) Bioenergetics breakdown in Alzheimer’s disease: targets for new therapies. Int J Physiol Pathophysiol Pharmacol 3: 133–139. - PMC - PubMed
    1. Götz J, Eckert A, Matamales M, Ittner L, Liu X (2011) Modes of Aβ toxicity in Alzheimer’s disease. Cellular and Molecular Life Sciences: 1–17. - PMC - PubMed
    1. Ja H, Ga H (1992) - Alzheimer’s disease: the amyloid cascade hypothesis. Science 256: 184–185. - PubMed

Publication types