. 2012;7(12):e49707.
doi: 10.1371/journal.pone.0049707. Epub 2012 Dec 3.

Metastatic pancreatic cancer is dependent on oncogenic Kras in mice

Affiliations

Metastatic pancreatic cancer is dependent on oncogenic Kras in mice

Meredith A Collins et al. PLoS One. 2012.

Abstract

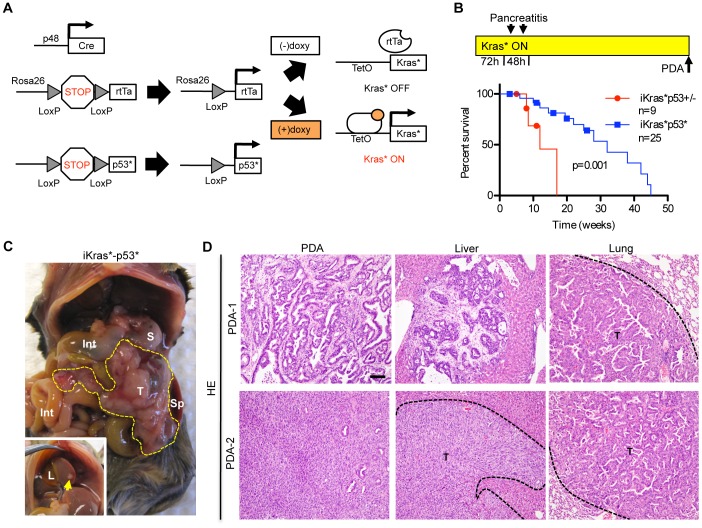
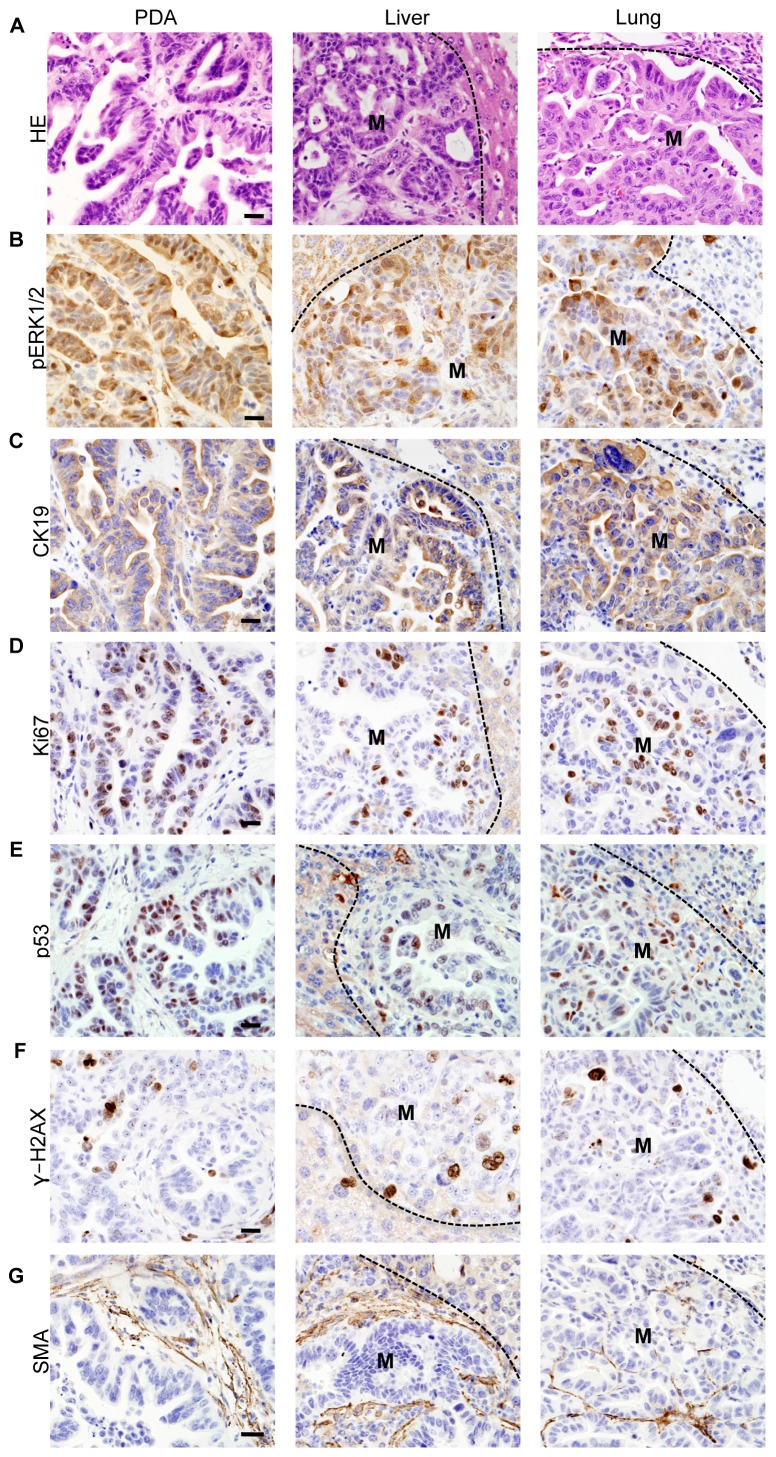
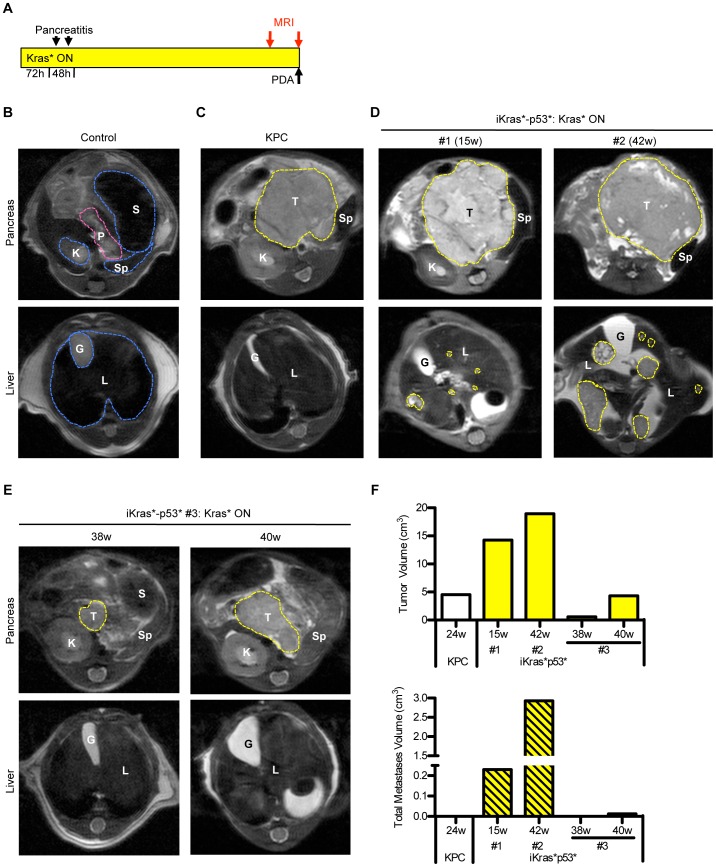
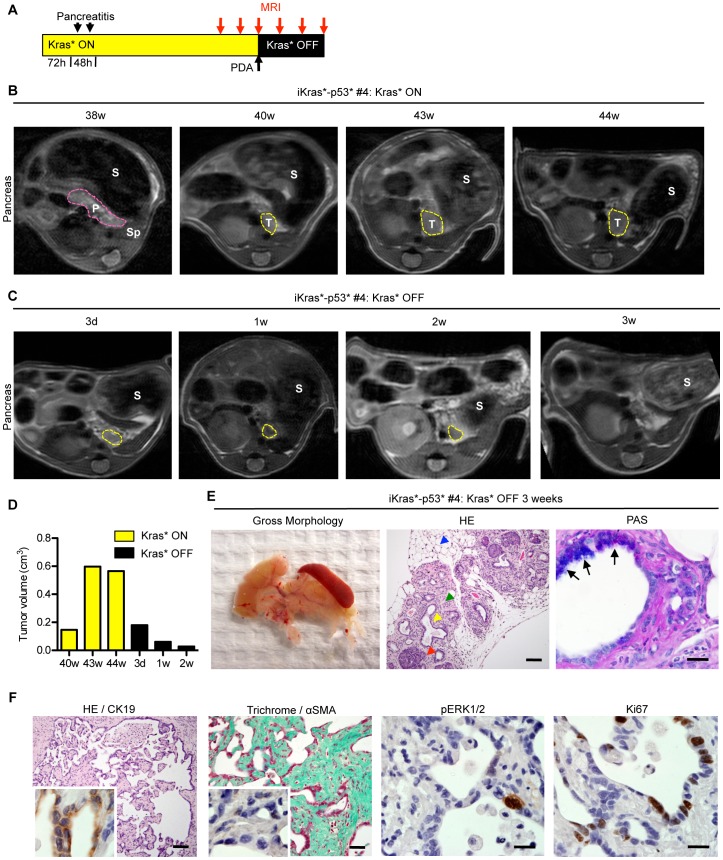
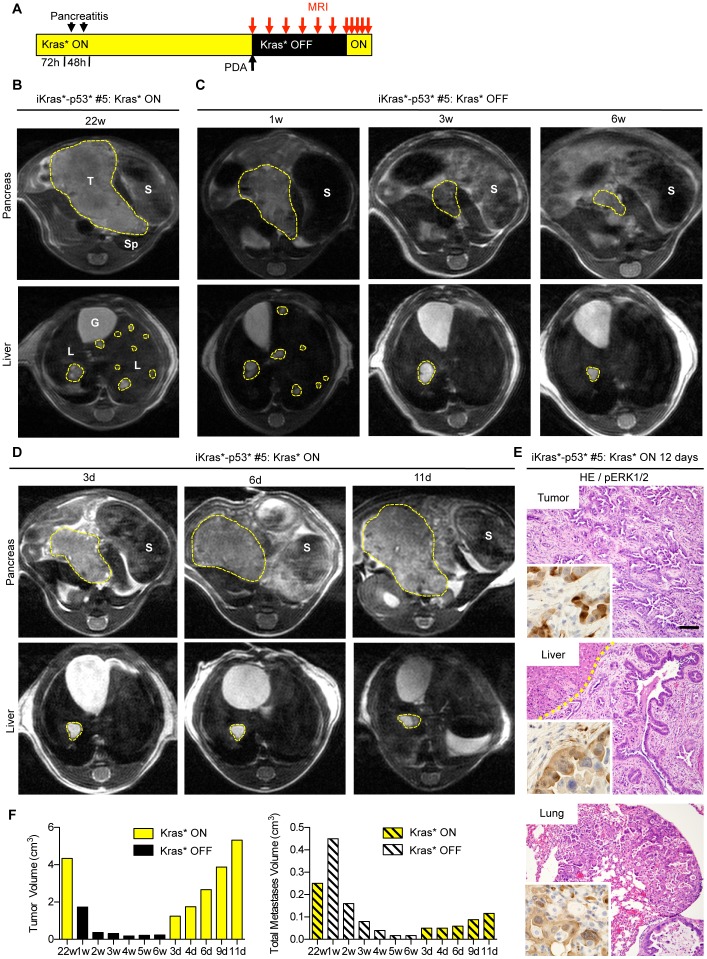
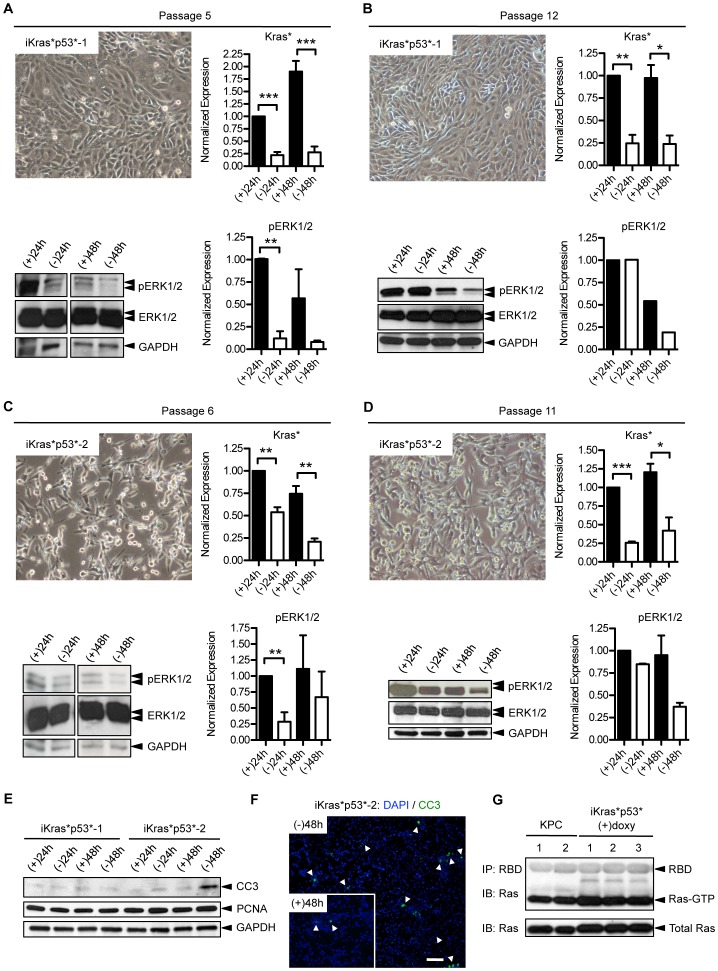
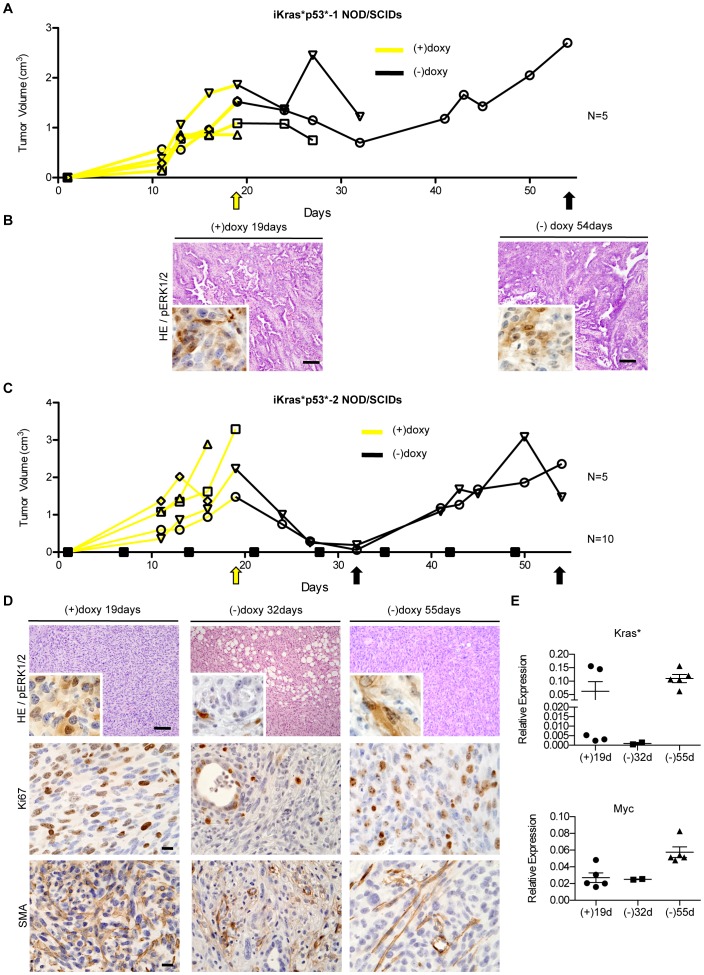
Pancreatic cancer is one of the deadliest human malignancies, and its prognosis has not improved over the past 40 years. Mouse models that spontaneously develop pancreatic adenocarcinoma and mimic the progression of the human disease are emerging as a new tool to investigate the basic biology of this disease and identify potential therapeutic targets. Here, we describe a new model of metastatic pancreatic adenocarcinoma based on pancreas-specific, inducible and reversible expression of an oncogenic form of Kras, together with pancreas-specific expression of a mutant form of the tumor suppressor p53. Using high-resolution magnetic resonance imaging to follow individual animals in longitudinal studies, we show that both primary and metastatic lesions depend on continuous Kras activity for their maintenance. However, re-activation of Kras* following prolonged inactivation leads to rapid tumor relapse, raising the concern that Kras*-resistance might eventually be acquired. Thus, our data identifies Kras* as a key oncogene in pancreatic cancer maintenance, but raises the possibility of acquired resistance should Kras inhibitors become available for use in pancreatic cancer.


Conflict of interest statement

Competing Interests: The authors have declared that no competing interests exist.

Figures

Figure 1
Figure 1. The iKras*p53* model of metastatic pancreatic adenocarcinoma.
(A) Genetic makeup of iKras*p53* mice. (B) Experimental design: doxy was administered continuously, starting at weaning. Acute pancreatitis was induced within 72 hrs, then the animals were aged until they developed tumors. Kaplan-Meier survival curve. iKras*p53*, n = 25; iKras*p53+/−, n = 9. Log-rank statistical analysis yielded a P value of 0.001. (C) Gross morphology pictures of a primary tumor and liver metastases. T: tumor, S: stomach, Sp: spleen, Int: intestine, L: liver (D). Histology of a moderately differentiated (top row) and an un-differentiated (bottom row) pancreatic tumor; liver and lung metastases. T: tumor. Scale bar 100 um.
Figure 2
Figure 2. Characterization of iKras*p53* primary tumor and metastases.
(A) Histology of a primary pancreatic adenocarcinoma and metastases to liver and lung. (B–G) Immunohistochemistry of primary tumor and metastases for: (B) phospho-ERK1/2; (C) CK19; (D) Ki67; (E) p53; (F) γH2AX; (G) αSMA. M: metastasis. Scale bar 20 um.
Figure 3
Figure 3. In vivo imaging of the pancreas, pancreatic tumors and metastases.
(A) Experimental design. (B) MRI of a control mouse pancreas and liver. P: pancreas, S: stomach, Sp: spleen, K: kidney, L: liver, G: gallbladder. (C) Large pancreatic mass (T), but no metastatic lesions in a KPC mouse. (D) Two iKras*p53* mice on doxy 15 weeks (left) and 42 weeks (right) show a large pancreatic mass and liver metastases. (E) Identification of smaller tumors (iKras*p53* #3, left panel, 38 weeks) can be monitored as they develop into larger tumors (iKras*p53* #3, right panel, 40weeks). (F) Volume measurements of both primary tumors and combined metastases for individual KPC and iKras*p53* animals at the indicated time points.
Figure 4
Figure 4. Longitudinal imaging of pancreatic tumor growth and regression.
(A) Experimental design. (B) MRI taken at 38 weeks after Kras* activation shows normal pancreas morphology. P: pancreas, S: stomach, Sp: spleen. However, in the same animal, there is evidence of a small pancreatic tumor (T) at 40weeks, 2 days, which continues to increase in size over the next four weeks. (C) Tumor regression occurs following Kras* inactivation. By three weeks, there is no longer an identifiable tumor mass. (D) Tumor volume at the indicated time points. (E) Gross morphology of the pancreas following Kras* inactivation - note the small pancreas with no evident tumor mass (left panel). Histology of the regressed tissue (HE, middle panel, Scale bar 100 um) reveals acini (red arrowhead) surrounded by fibrosis (green arrowhead) and adipose tissue (blue arrowhead) with dilated ducts (yellow arrowhead) containing some cells that exhibit mucin accumulation identified by arrows (PAS staining, right panel, Scale bar 20 um). (F) Histology of fibrotic cysts, indicating a possible previous tumor site (HE, left panel), are lined with cells that are CK19 positive (inset). Scale bar 100 um. Gomori Trichrome (Scale bar 100 um), SMA staining (inset), p-ERK1/2, and Ki67 staining indicate that the remaining fibrosis is no longer reactive. Scale bars 20 um.
Figure 5
Figure 5. Pancreatic tumor relapse occurs following Kras* reactivation.
(A) Experimental design. (B) Identification of a large pancreatic tumor mass 22 weeks after Kras* activation. T: tumor, S: stomach, Sp: spleen, L: liver, G: gallbladder. (C) Images taken 1, 3 and 6 weeks following Kras* inactivation. Note the greatly reduced primary tumor mass and metastatic load. (D) Reactivation of Kras* results in rapid tumor relapse. (E) Histology of the primary tumor as well as metastases found in the liver and lung following tumor relapse show abundant phospho-ERK1/2 expression (insets). Scale bar 100 um (F) Tumor and total metastases volume at the indicated time points.
Figure 6
Figure 6. Characterization of primary pancreatic cancer cell lines from iKras*p53* mice.
(A) Primary cell line iKras*p53*-1 exhibits epithelial morphology and demonstrates doxycycline dependent Kras* expression (* p<0.05), and pERK1/2 levels at passage 5. (B) The same cell line at passage 12; Kras* expression is still dependent on doxy (*** p<0.001), but pERK1/2 levels do not depend on Kras* expression. (C) A second primary cell line, iKras*p53*-2, has mesenchymal morphology. At passage 6, Kras* expression is dependent on doxy (** p<0.01), and pERK1/2 levels depend on Kras* expression. (D) Analysis at passage 11: Kras* is still regulated by doxy (* p<0.05, ** p<0.01), but pERK1/2 levels remain elevated. (E) Western blot analysis of apoptosis, indicated by cleaved caspase-3 (CC3), and proliferation, measured by proliferating cell nuclear antigen (PCNA), in both iKras*p53*-1 and iKras*p53*-2 cell lines. (F) Immunofluorescence of apoptosis, indicated by cleaved caspase-3 (CC3), in iKras*p53*-2 cells either in the presence of (+48 h) or absence (−48 h) of doxy in the media. DAPI staining marks the nuclei. Scale bar 100 um. (G) Ras pull-down assay demonstrates that Ras activity levels are comparable between iKras*p53* cell lines and cells from KPC tumors.
Figure 7
Figure 7. iKras*p53* cells reactivate Kras* expression independently of doxycycline regulation.
(A) Tumor volume measured over time for iKras*p53*-1 cells transplanted subcutaneously in NOD/SCID mice. The yellow line indicates the presence of doxy, black lines indicate the absence of doxy, arrows indicate harvest time-points. N = 5. (B) Histology and phospho-ERK1/2 expression (inset) of iKras*p53*-1 tumors harvested during the initial growth phase and of relapsed tumors. Scale bar 100 um. (C) Tumor formation, regression, and relapse in NOD/SCID mice injected subcutaneously with primary cell line iKras*p53*-2. N = 5. A second cohort of NOD/SCID mice were injected with iKras*p53*-2 cells, but maintained in the absence of doxy which do not develop tumors. N = 10. The yellow line indicates the presence of doxy, black lines indicate the absence of doxy, arrows indicate harvest time-points. (D) Histology and pERK1/2 (inset), Ki67 and SMA expression of iKras*p53*-2 tumors during growth, regression, and relapse phases. Scale bar 100 um. (E) Quantitative PCR for oncogenic Kras* and myc expression in iKras*p53*-2 tumors.

References

    1. Jones S, Zhang X, Parsons DW, Lin JC, Leary RJ, et al. (2008) Core signaling pathways in human pancreatic cancers revealed by global genomic analyses. Science 321: 1801–1806. - PMC - PubMed
    1. Hruban RH, Adsay NV, Albores-Saavedra J, Compton C, Garrett ES, et al. (2001) Pancreatic intraepithelial neoplasia: a new nomenclature and classification system for pancreatic duct lesions. Am J Surg Pathol 25: 579–586. - PubMed
    1. Petitjean A, Mathe E, Kato S, Ishioka C, Tavtigian SV, et al. (2007) Impact of mutant p53 functional properties on TP53 mutation patterns and tumor phenotype: lessons from recent developments in the IARC TP53 database. Hum Mutat 28: 622–629. - PubMed
    1. Hingorani SR, Wang L, Multani AS, Combs C, Deramaudt TB, et al. (2005) Trp53R172H and KrasG12D cooperate to promote chromosomal instability and widely metastatic pancreatic ductal adenocarcinoma in mice. Cancer Cell 7: 469–483. - PubMed
    1. Olive KP, Tuveson DA (2006) The use of targeted mouse models for preclinical testing of novel cancer therapeutics. Clin Cancer Res 12: 5277–5287. - PubMed

Publication types