

Severe childhood malaria syndromes defined by plasma proteome profiles
- PMID: 23226502
- PMCID: PMC3514223
- DOI: 10.1371/journal.pone.0049778
Severe childhood malaria syndromes defined by plasma proteome profiles
Abstract
Background: Cerebral malaria (CM) and severe malarial anemia (SMA) are the most serious life-threatening clinical syndromes of Plasmodium falciparum infection in childhood. Therefore it is important to understand the pathology underlying the development of CM and SMA, as opposed to uncomplicated malaria (UM). Different host responses to infection are likely to be reflected in plasma proteome-patterns that associate with clinical status and therefore provide indicators of the pathogenesis of these syndromes.
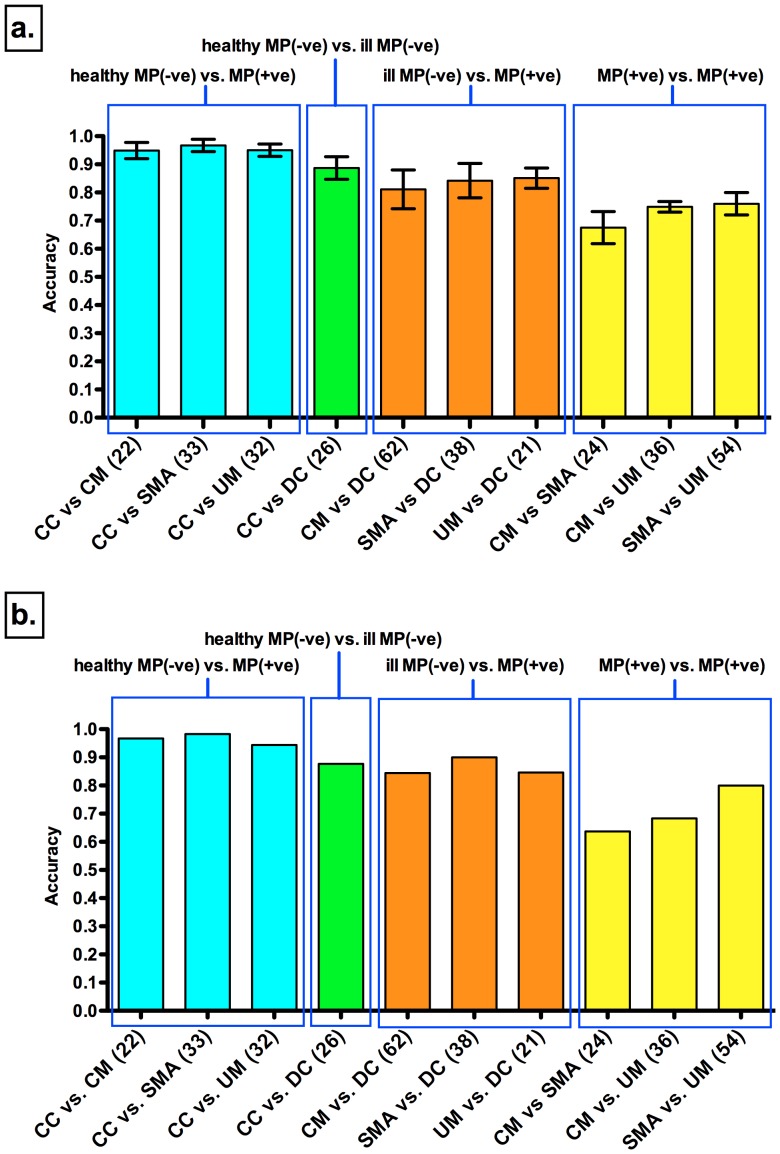
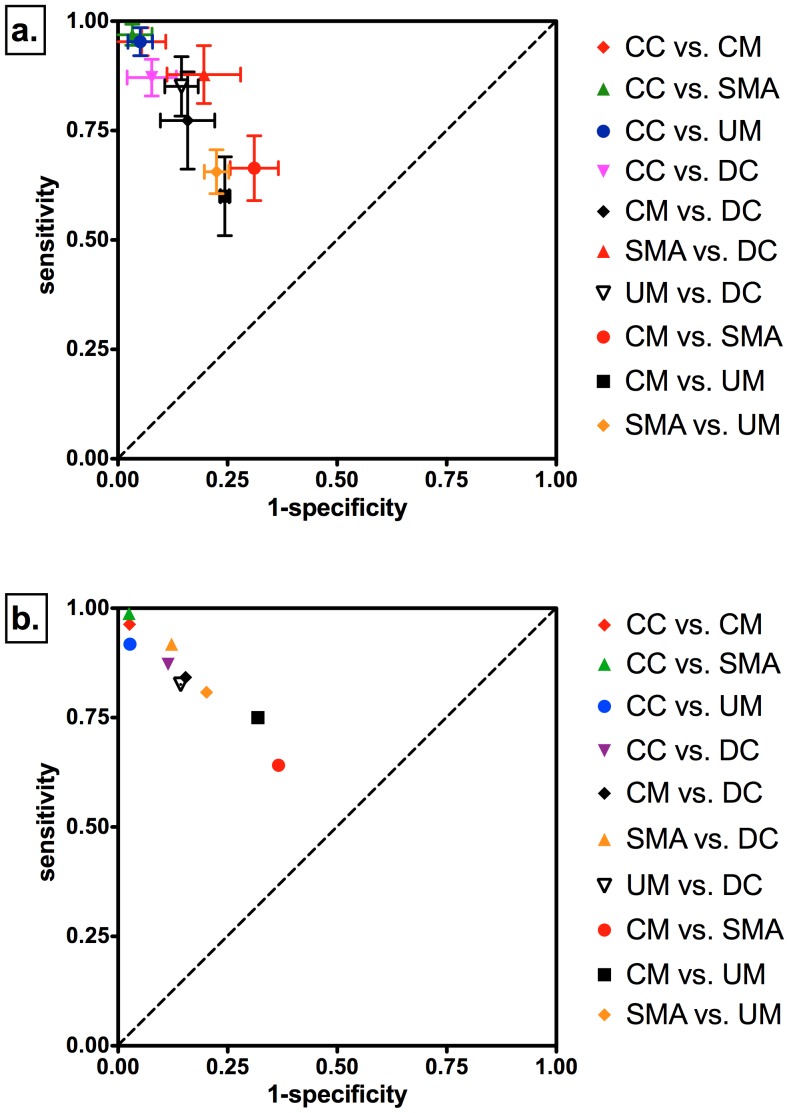
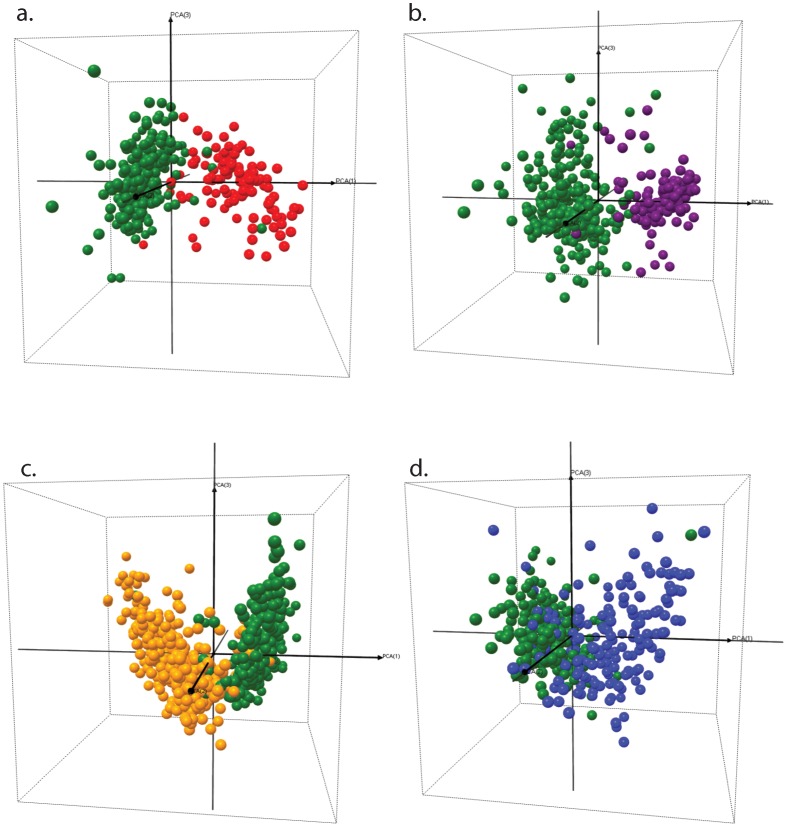
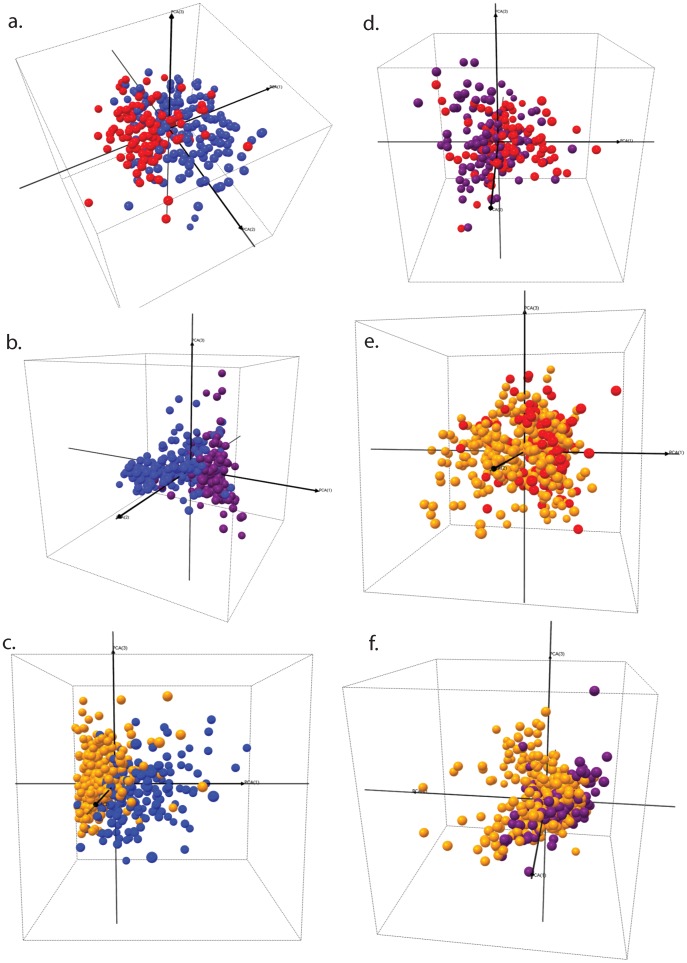
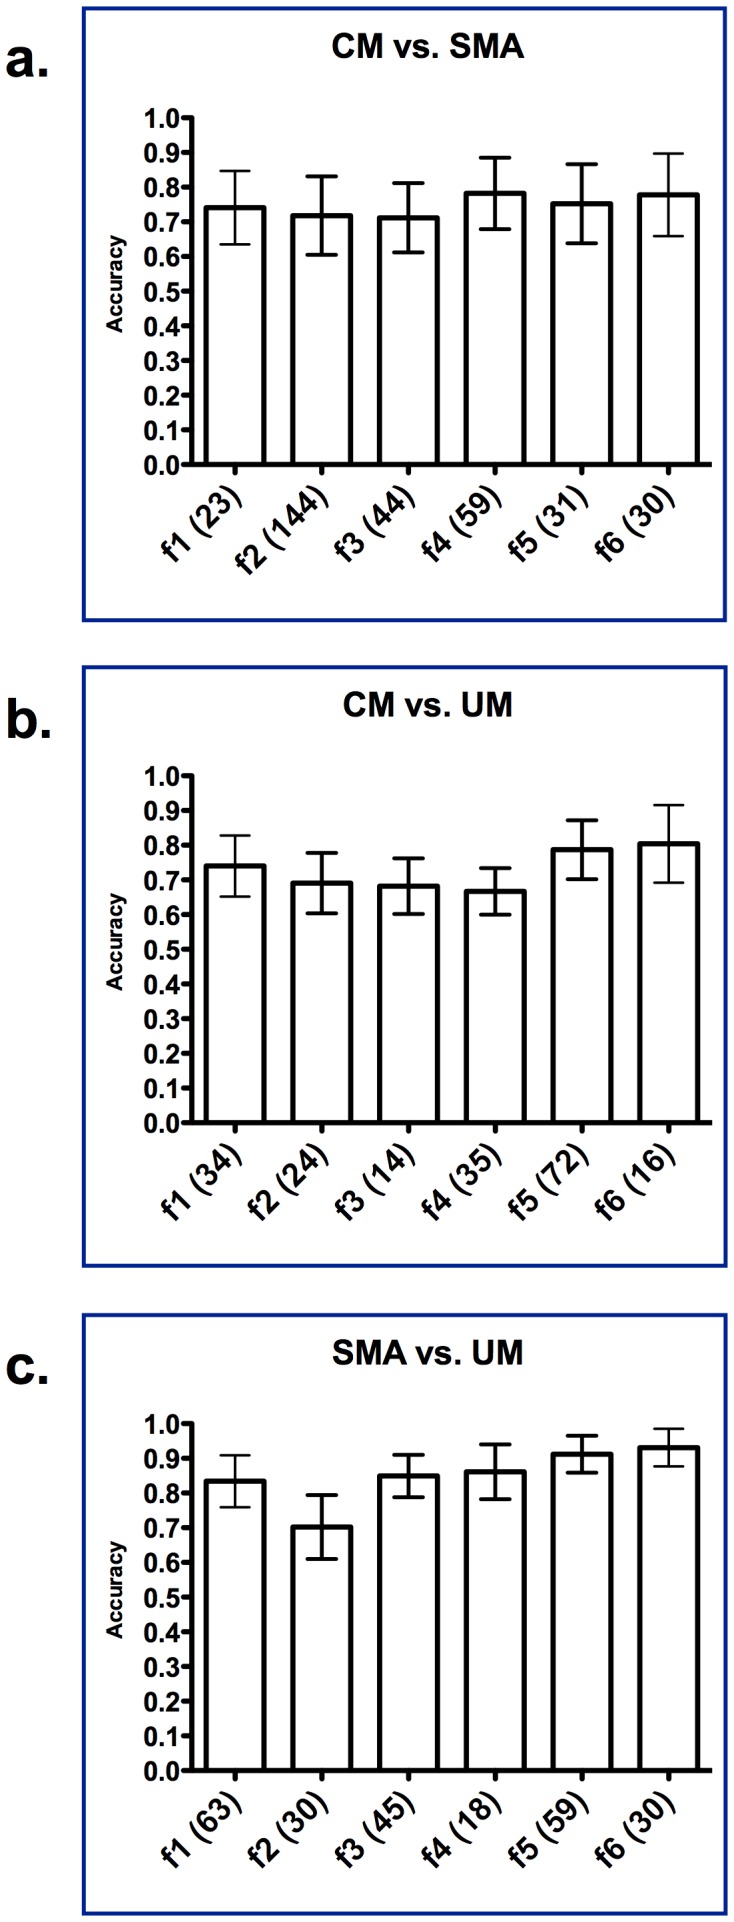
Methods and findings: Plasma and comprehensive clinical data for discovery and validation cohorts were obtained as part of a prospective case-control study of severe childhood malaria at the main tertiary hospital of the city of Ibadan, an urban and densely populated holoendemic malaria area in Nigeria. A total of 946 children participated in this study. Plasma was subjected to high-throughput proteomic profiling. Statistical pattern-recognition methods were used to find proteome-patterns that defined disease groups. Plasma proteome-patterns accurately distinguished children with CM and with SMA from those with UM, and from healthy or severely ill malaria-negative children.
Conclusions: We report that an accurate definition of the major childhood malaria syndromes can be achieved using plasma proteome-patterns. Our proteomic data can be exploited to understand the pathogenesis of the different childhood severe malaria syndromes.
Conflict of interest statement
Figures
Similar articles
-
Circulatory hepcidin is associated with the anti-inflammatory response but not with iron or anemic status in childhood malaria.Blood. 2013 Apr 11;121(15):3016-22. doi: 10.1182/blood-2012-10-461418. Epub 2013 Feb 4. Blood. 2013. PMID: 23380741 Free PMC article.
-
Depleted circulatory complement-lysis inhibitor (CLI) in childhood cerebral malaria returns to normal with convalescence.Malar J. 2020 Apr 26;19(1):167. doi: 10.1186/s12936-020-03241-5. Malar J. 2020. PMID: 32336276 Free PMC article.
-
Chitinase 3-like 1 is induced by Plasmodium falciparum malaria and predicts outcome of cerebral malaria and severe malarial anaemia in a case-control study of African children.Malar J. 2014 Jul 21;13:279. doi: 10.1186/1475-2875-13-279. Malar J. 2014. PMID: 25047113 Free PMC article.
-
Folic acid supplementation and malaria susceptibility and severity among people taking antifolate antimalarial drugs in endemic areas.Cochrane Database Syst Rev. 2022 Feb 1;2(2022):CD014217. doi: 10.1002/14651858.CD014217. Cochrane Database Syst Rev. 2022. PMID: 36321557 Free PMC article.
-
Severe malarial anemia: innate immunity and pathogenesis.Int J Biol Sci. 2011;7(9):1427-42. doi: 10.7150/ijbs.7.1427. Epub 2011 Nov 2. Int J Biol Sci. 2011. PMID: 22110393 Free PMC article. Review.
Cited by
-
Data-driven malaria prevalence prediction in large densely populated urban holoendemic sub-Saharan West Africa.Sci Rep. 2020 Sep 28;10(1):15918. doi: 10.1038/s41598-020-72575-6. Sci Rep. 2020. PMID: 32985514 Free PMC article.
-
Circulatory hepcidin is associated with the anti-inflammatory response but not with iron or anemic status in childhood malaria.Blood. 2013 Apr 11;121(15):3016-22. doi: 10.1182/blood-2012-10-461418. Epub 2013 Feb 4. Blood. 2013. PMID: 23380741 Free PMC article.
-
The IL17F and IL17RA Genetic Variants Increase Risk of Cerebral Malaria in Two African Populations.Infect Immun. 2015 Dec 14;84(2):590-7. doi: 10.1128/IAI.00671-15. Print 2016 Feb. Infect Immun. 2015. PMID: 26667835 Free PMC article.
-
A Functional IL22 Polymorphism (rs2227473) Is Associated with Predisposition to Childhood Cerebral Malaria.Sci Rep. 2017 Jan 31;7:41636. doi: 10.1038/srep41636. Sci Rep. 2017. PMID: 28139719 Free PMC article.
-
Quantitative trait locus analysis of parasite density reveals that HbS gene carriage protects severe malaria patients against Plasmodium falciparum hyperparasitaemia.Malar J. 2015 Oct 7;14:393. doi: 10.1186/s12936-015-0920-z. Malar J. 2015. PMID: 26445879 Free PMC article.
References
-
- Korenromp E (2005) Malaria incidence estimates at country level for the year 2004. Geneva, Switzerland: World Health Organization.
Publication types
MeSH terms
Substances
Grants and funding
LinkOut - more resources
Full Text Sources
