. 2010:2:99-116.
doi: 10.2147/EB.S9078. Epub 2010 Jul 22.

Energy metabolism of the visual system

Affiliations

Energy metabolism of the visual system

Margaret T T Wong-Riley. Eye Brain. 2010.

Abstract

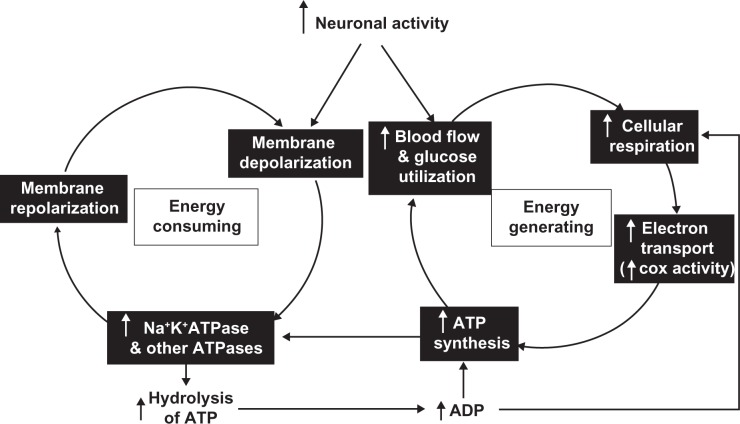
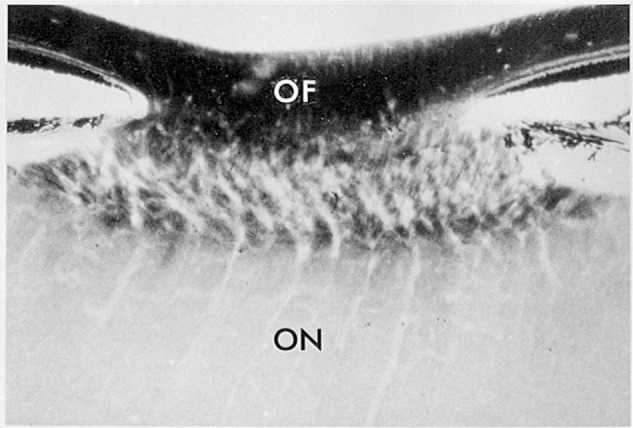
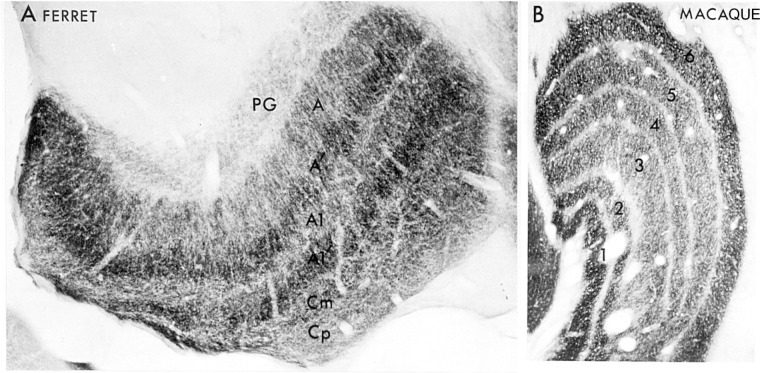
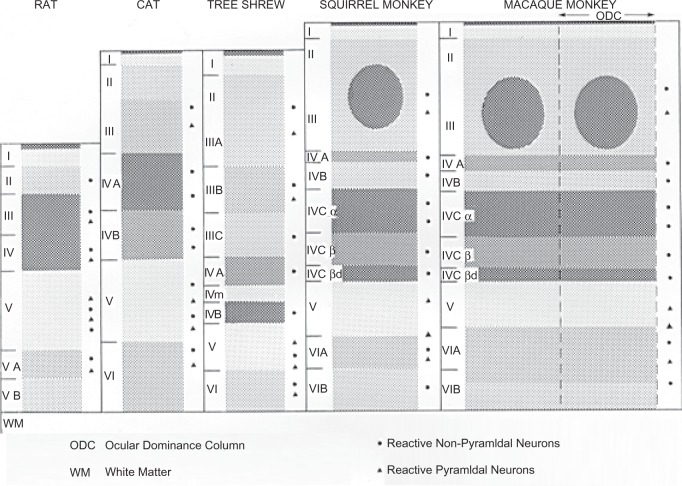
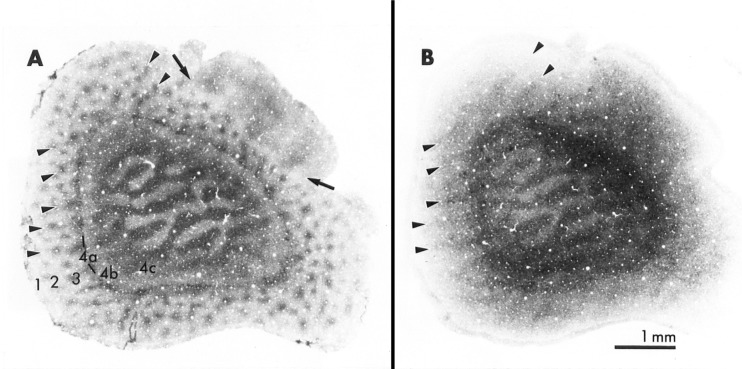
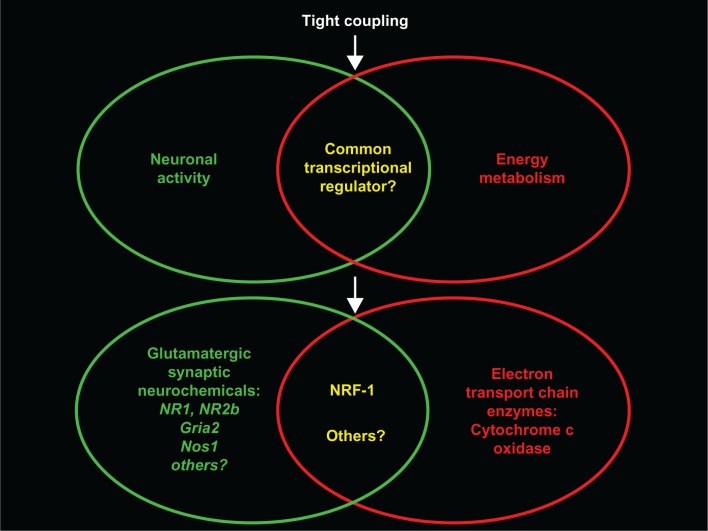
The visual system is one of the most energetically demanding systems in the brain. The currency of energy is ATP, which is generated most efficiently from oxidative metabolism in the mitochondria. ATP supports multiple neuronal functions. Foremost is repolarization of the membrane potential after depolarization. Neuronal activity, ATP generation, blood flow, oxygen consumption, glucose utilization, and mitochondrial oxidative metabolism are all interrelated. In the retina, phototransduction, neurotransmitter utilization, and protein/organelle transport are energy-dependent, yet repolarization-after-depolarization consumes the bulk of the energy. Repolarization in photoreceptor inner segments maintains the dark current. Repolarization by all neurons along the visual pathway following depolarizing excitatory glutamatergic neurotransmission preserves cellular integrity and permits reactivation. The higher metabolic activity in the magno- versus the parvo-cellular pathway, the ON- versus the OFF-pathway in some (and the reverse in other) species, and in specialized functional representations in the visual cortex all reflect a greater emphasis on the processing of specific visual attributes. Neuronal activity and energy metabolism are tightly coupled processes at the cellular and even at the molecular levels. Deficiencies in energy metabolism, such as in diabetes, mitochondrial DNA mutation, mitochondrial protein malfunction, and oxidative stress can lead to retinopathy, visual deficits, neuronal degeneration, and eventual blindness.


Conflict of interest statement

Disclosure

The author reports no conflicts of interest in this work.

Figures

Figure 1
Figure 1
Schematic diagram of the tight coupling between neuronal activity and energy metabolism. Depolarizing neuronal activity requires the action of Na+K+ATPase and other ATPases to repolarize the membrane for reactivation. This is the single most energy-consuming function of neurons. Such energy demand is met under normal conditions by increased blood flow and glucose utilization and increased cellular respiration in the mitochondria, where electron transport is coupled to oxidative phosphorylation, resulting in the synthesis of ATP. Cytochrome c oxidase (COX) is the terminal enzyme of the electron transport chain and reflects the oxidative capacity of neurons. The hydrolysis of ATP by the ATPases yields ADP, which is used to resynthesize ATP and is itself a controlling factor for cellular respiration.
Figure 2
Figure 2
Transverse sections of cytochrome c oxidase-reacted retinas from ferret (A), cat (B), squirrel monkey (C), and macaque monkey (D and E). A universal pattern is an intense labeling of the inner segments of photoreceptor cells and a dense labeling of cone pedicles (small arrows), the outer and inner plexiform layers, horizontal cells, the large ganglion cells, and the nerve fiber layer. Note that the OFF-sublamina-a of IPL in the ferret and cat is more reactive than the ON-sublamina-b, but the reverse is true for the primate, especially in the central portion of the retina (E). Arrowheads point to blood vessels. Abbreviations: PE, pigment epithelium (removed from ferret and cat); OS, outer segment; IS, inner segment; ONL, outer nuclear layer; OPL, outer plexiform layer; INL, inner nuclear layer; IPL, inner plexiform layer, subdivided into a and b sublayers; GCL, ganglion cell layer; NFL, nerve fiber layer. Modified with permission from Kageyana and Wong-Riley.
Figure 3
Figure 3
Comparison of sections of the macaque retina reacted for cytochrome c oxidase (COX) (A) or immunoreacted for Na+K+ATPase (B) The patterns are comparable between the two, except that cytochrome c oxidase labeling is more prominent in the IPL, whereas the OPL is more intensely labeled by Na+K+ATPase. The pigment epithelium (PE), especially the apical portion, is strongly labeled by both. Abbreviations are the same as in Figure 2.
Figure 4
Figure 4
A) A tangential section of cytochrome c oxidase-reacted macaque retina through the inner segments of photoreceptor cells. Note that cone inner segments are much larger and are more intensely labeled by cytochrome c oxidase than those in rods. B) At the electron microscopic level, cone inner segments (CIS) contain much larger and more closely packed mitochondria than do rods. Modified with permission from Kageyana and Wong-Riley 1984.
Figure 5
Figure 5
A transverse section of squirrel monkey optic disk. The unmyelinated portions of retinal ganglion cell axons (OF, optic fibers) within the eye are darkly reactive for cytochrome c oxidase. Labeling falls precipitously at the lamina cribosa, where the axons acquire myelin sheaths and form the optic nerve (ON). Modified with permission from Kageyana and Wong-Riley 1984.
Figure 6
Figure 6
A) A parasagittal section of ferret lateral geniculate nucleus reacted for cytochrome c oxidase. Sublaminae A′ and A1′ representing the OFF-pathway have higher enzyme levels than the ON-sublaminae A and A1. Magnocellular lamina C (Cm) is also more reactive than the parvocellular lamina C (Cp). The perigeniculate nucleus (PG) is only lightly labeled. B) Coronal section of the macaque LGN reacted for cytochrome c oxidase. The pattern of metabolic activity probably reflects a combination of greater functional activity in a) the magnocellular layers 1 and 2 than the parvocellular layers 3–5; b) the ON-pathway-dominant layers 5 and 6 than the OFF-pathway-dominant layers 3 and 4; and c) the contralateral pathway in layers 1 and 6 than the ipsilateral pathway in layers 2 and 5. Modified with permission from Kageyana and Wong-Riley 1984.
Figure 7
Figure 7
A schematic diagram depicting the general laminar and cellular patterns of labeling with cytochrome c oxidase in the primary visual cortex of various mammals studied (laminae are not drawn strictly to scale). The degree of darkness reflects the intensity of labeling. The basic pattern of metabolic activity is phylogenetically constant, with the geniculate-recipient layer IV having the highest energy demand. Primates evolved a more elaborate layer IV and supragranular cytochrome c oxidase-rich puffs centered on ocular dominance columns. Modified with permission from Wong-Riley 1988.
Figure 8
Figure 8
Tangential sections of the primary visual cortex from a macaque monkey whose left eye was functionally inactivated with TTX for 3 weeks. Serial sections were reacted histochemically either for cytochrome c oxidase (A) or Na+K+ATPase (B). Cortical layers are indicated by numerals. Note the light and dark banding pattern in layer 4c that is normally homogeneously and intensely labeled by both markers. In the supragranular layers 2–3, rows of large, darkly-labeled puffs (arrowheads) alternate with rows of small, lightly-labeled puffs. The lighter bands in 4c and lighter puffs correspond to the functionally inactivated eye. Large arrows indicate the border between area 17 and area 18. In area 18, thick and thin stripes with larger puff-like labeling within them are detectable (the pattern is more clearly seen in A). Modified with permission from Hevner et al 1992.
Figure 9
Figure 9
Schematic diagram of the tight coupling between energy metabolism and neuronal activity co-regulated at the transcriptional level by the same transcription factor NRF-1 (nuclear respiratory factor 1). Recent studies (Dhar and Wong-Riley, 2009; Dhar et al 2008, 2009, 2009148) indicate that NRF-1 regulates the expression of not only all 13 subunit genes of cytochrome c oxidase (reflecting energy metabolism) but also genes of several neurochemicals associated with glutamatergic neurotransmission, including NMDA receptor subunits 1 and 2B (genes NR1 and NR2b), AMPA receptor subunit 2 (GluR2; gene Gria2), and neuronal nitric oxide synthase (nNOS, gene Nos1). This ensures high efficiency in matching energy production with energy demand of neuronal activity.

References

    1. Rolfe DF, Brown GC. Cellular energy utilization and molecular origin of standard metabolic rate in mammals. Physiol Rev. 1997;77:731–758. - PubMed
    1. Clarke DD, Sokoloff L. Circulation and energy metabolism of the brain. In: Siegel GJ, Agranoff BW, Albers RW, Fisher SK, Uhler MD, editors. Basic Neurochemistry: Molecular, Cellular and Medical Aspects. Philadelphia: Lippincott-Raven; 1999. pp. 637–669.
    1. Weber B, Keller AL, Reichold J, Logothetis NK. The microvascular system of the striate and extrastriate visual cortex of the macaque. Cereb Cortex. 2008;18:2318–2330. - PubMed
    1. Niven JE, Laughlin SB. Energy limitation as a selective pressure on the evolution of sensory systems. J Exp Biol. 2008;211:1792–1804. - PubMed
    1. Ames A., 3rd CNS energy metabolism as related to function. Brain Res Reviews. 2000;34:42–68. - PubMed