. 2012 Dec 3:6:57.
doi: 10.3389/fncel.2012.00057. eCollection 2012.

Presynaptic GABA(B) Receptor Regulates Activity-Dependent Maturation and Patterning of Inhibitory Synapses through Dynamic Allocation of Synaptic Vesicles

Affiliations

Presynaptic GABA(B) Receptor Regulates Activity-Dependent Maturation and Patterning of Inhibitory Synapses through Dynamic Allocation of Synaptic Vesicles

Yu Fu et al. Front Cell Neurosci. .

Abstract

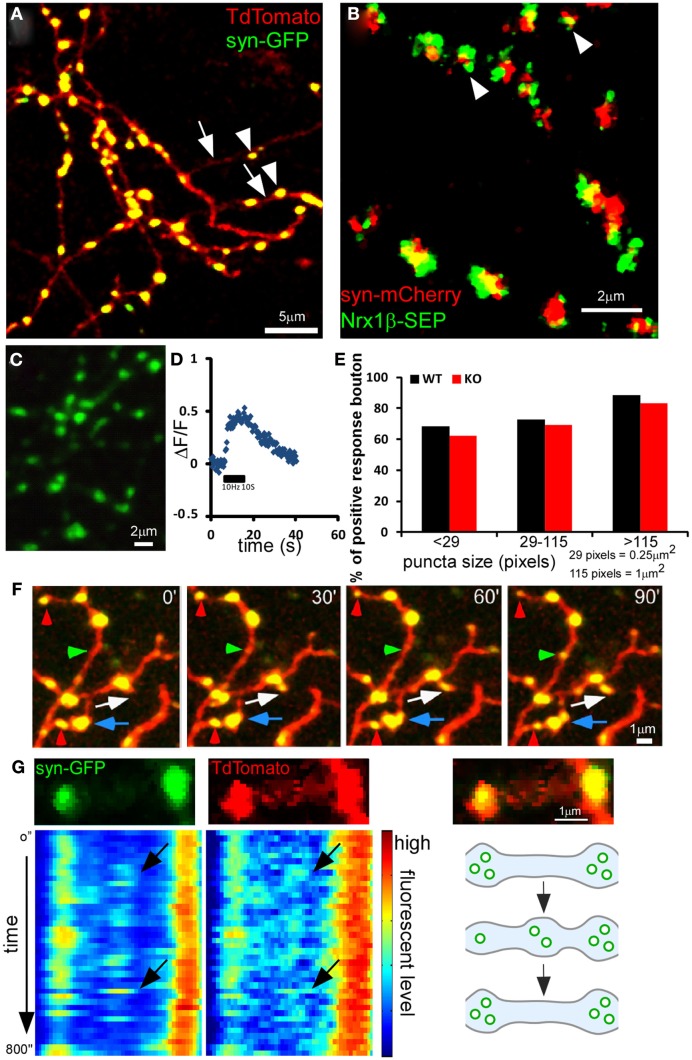
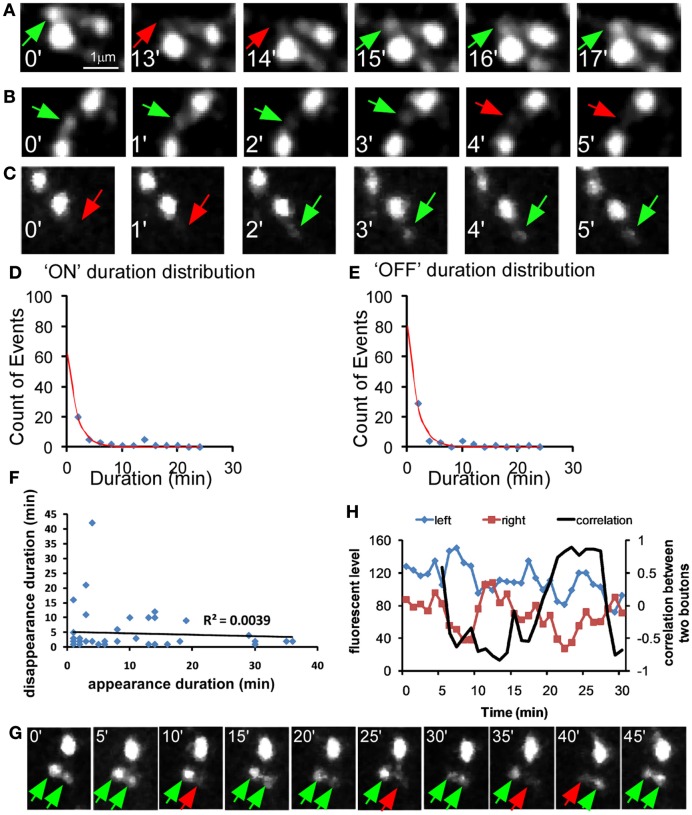
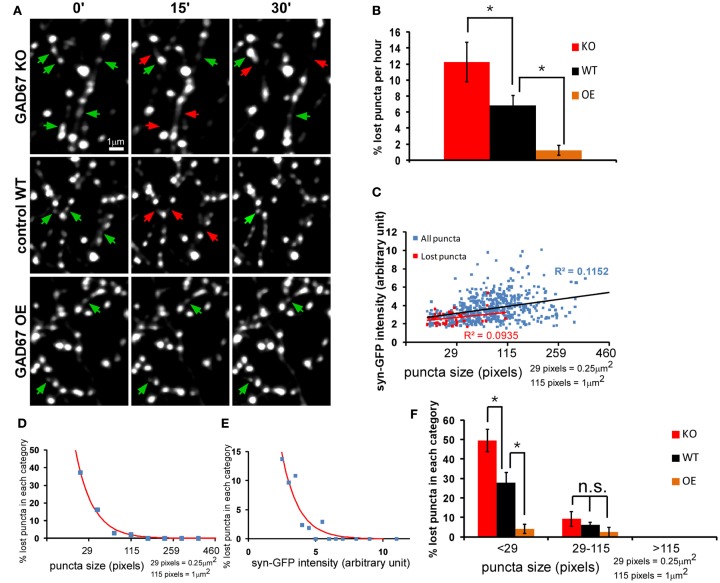
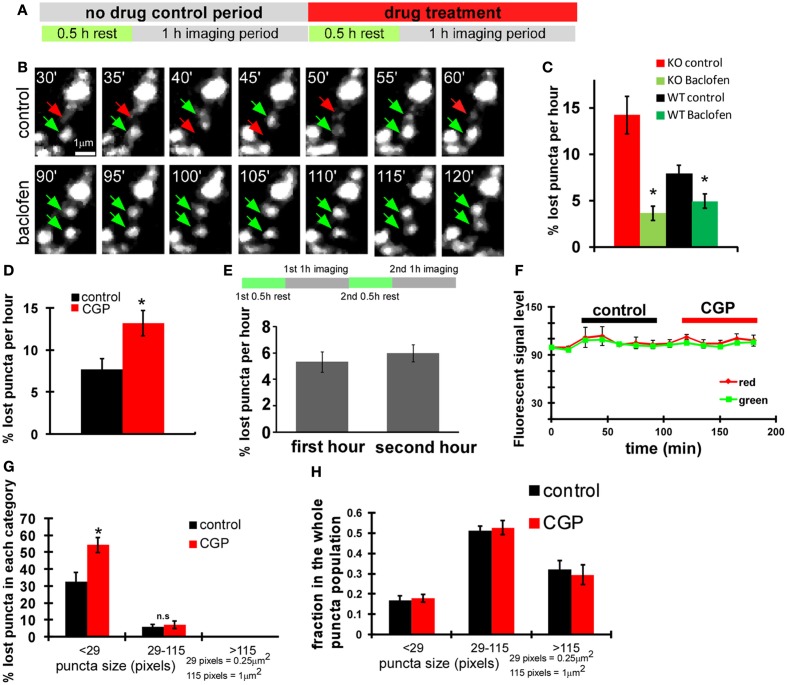
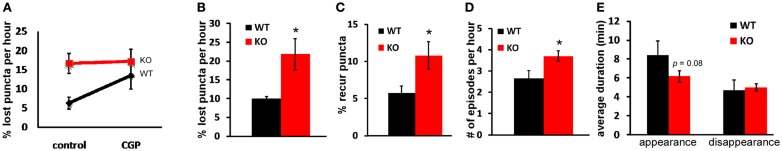
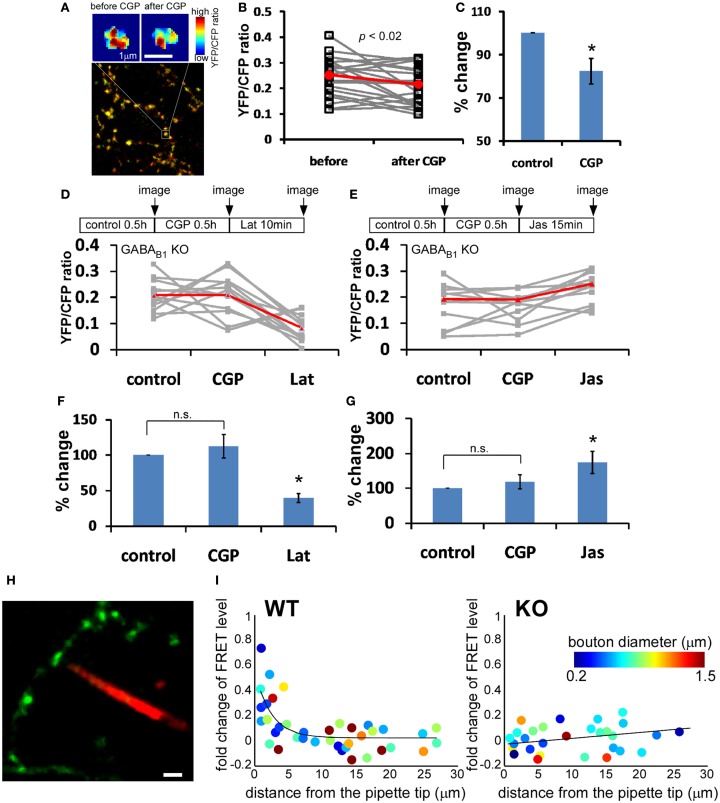
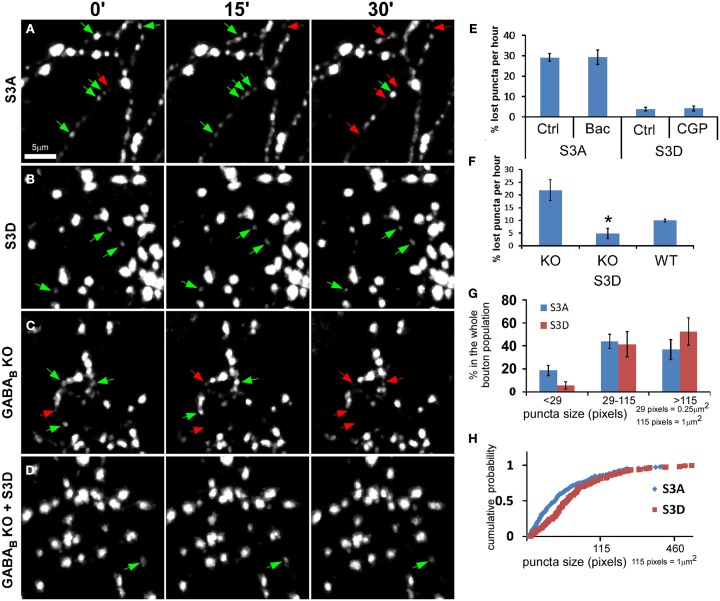
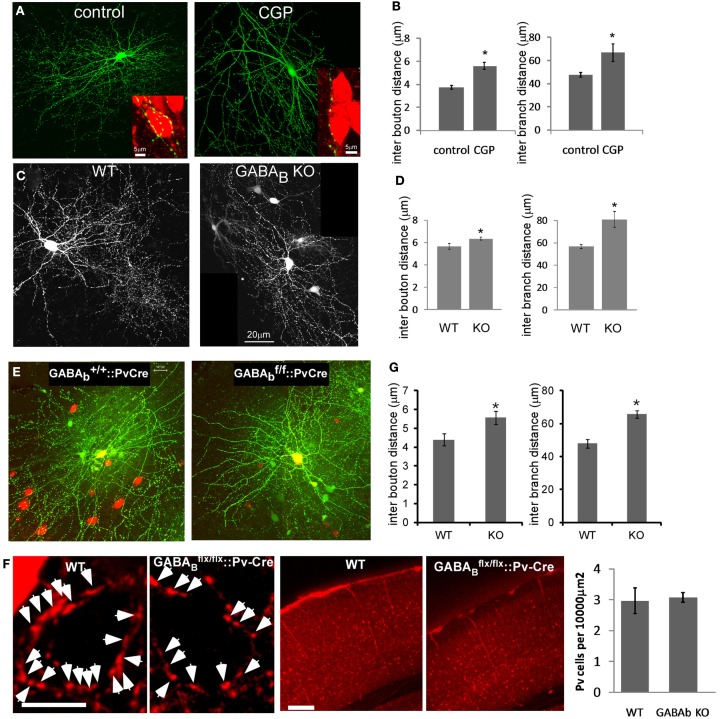
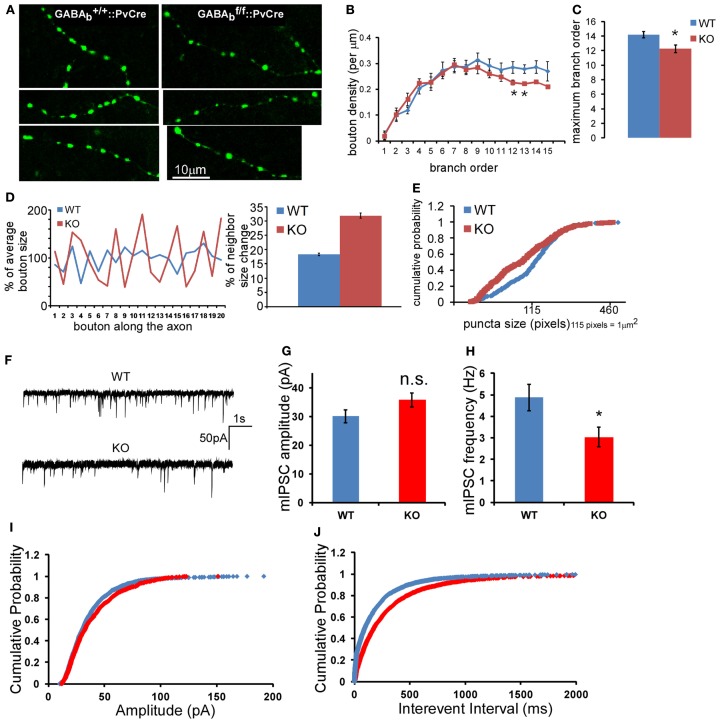
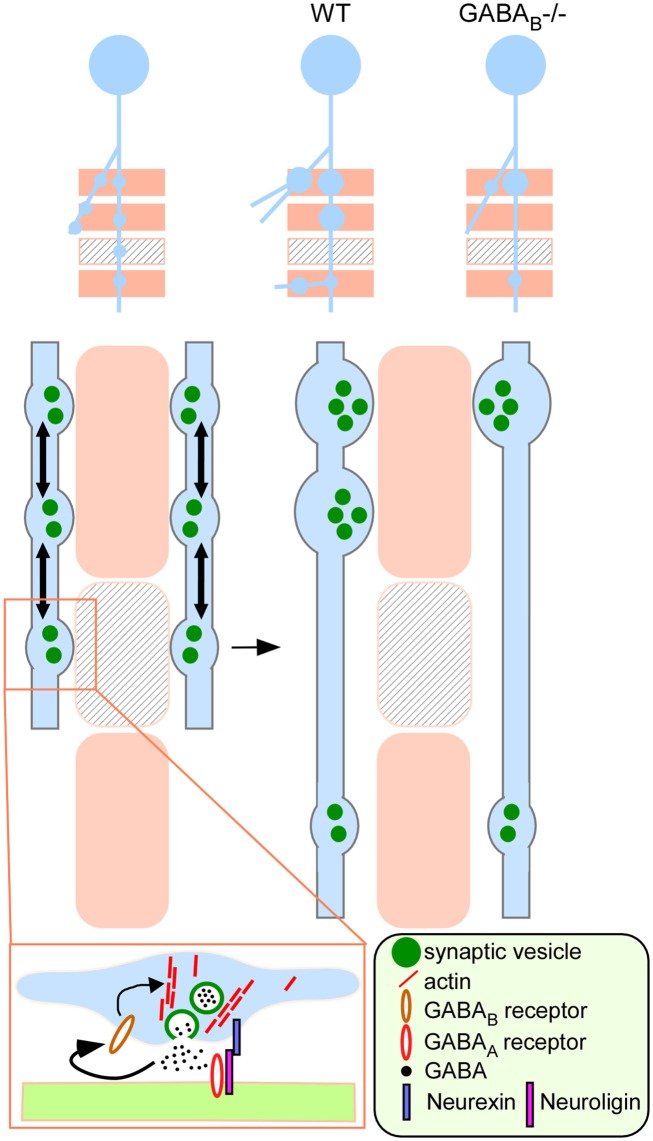
Accumulating evidence indicate that GABA regulates activity-dependent development of inhibitory synapses in the vertebrate brain, but the underlying mechanisms remain unclear. Here we combined live imaging of cortical GABAergic axons with single cell genetic manipulation to dissect the role of presynaptic GABA(B) receptors (GABA(B)Rs) in inhibitory synapse formation in mouse. Developing GABAergic axons form a significant number of transient boutons but only a subset was stabilized. Synaptic vesicles in these nascent boutons are often highly mobile in the course of tens of minutes. Activation of presynaptic GABA(B)Rs stabilized mobile vesicles in nascent boutons through the local enhancement of actin polymerization. Inactivation of GABA(B)Rs in developing basket interneurons resulted in aberrant pattern of bouton size distribution, reduced bouton density and reduced axon branching, as well as reduced frequency of miniature inhibitory currents in postsynaptic pyramidal neurons. These results suggest that GABA(B)Rs along developing inhibitory axons act as a local sensor of GABA release and promote presynaptic maturation through increased recruitment of mobile vesicle pools. Such release-dependent validation and maturation of nascent terminals is well suited to sculpt the pattern of synapse formation and distribution along axon branches.

Keywords: FRET; GABAB receptor; actin polymerization; activity-dependent development; inhibitory synapses; live cell imaging; synaptic vesicle dynamics.


Figures

Figure 1
Figure 1
Dynamics of presynaptic boutons and synaptic vesicle pools in developing GABAergic axons. Cortical organotypic slice cultures were biolistically transfected at ∼EP14 and two-photon images were taken at ∼EP18 at 910 nm for GFP or 990 nm for mCherry. Representative images are shown. (A) Axons of a basket neuron transfected with PG67-TdTomato and PG67-syn-GFP. Arrows indicate axon shafts and arrowheads indicate boutons and syn-GFP puncta. (B) Axons of a basket neuron transfected with Lox-STOP-Lox(LSL)-NRX1β-SEP and LSL-syn-mCherry in slice cultures from PV-ires-Cre mice. Note that almost all syn-mCherry puncta contain NRX1β-SEP (arrowheads). (C) Axons of a basket neuron transfected with LSL-syn-SEP using slice culture of PV-ires-Cre mice. (D) Representative fluorescent level changes on a single bouton along a basket cell axon expressing syn-SEP, after a 10s 10 Hz stimulation. (E) Syn-SEP was expressed in PV-ires-Cre slice culture from EP15, and the expressing neurons were patch clamped and imaged at EP20. Fluorescent changes on single boutons were recorded during and after 10s of 10 Hz stimulation. Boutons showed significant positive increase of fluorescent was quantified for both WT (182 boutons from seven cells) and GABAB1flx/flx::PV-ires-Cre slice culture (218 boutons from seven cells). Fisher’s-exact test of the proportion of functional boutons in both WT and GABABR KO neurons in different size population showed no significant difference. (F) Axon terminals in (A) were imaged at 30 min intervals. Red arrowheads indicate boutons that shrink and diminish their syn-GFP signal. Green arrowheads indicate bouton that enlarge and accumulate syn-GFP. The blue arrow indicates newly formed boutons that split from a larger bouton. The white arrow indicates a newly formed bouton on a newly grown branch. (G) The dynamics of syn-GFP puncta closely correlated with that of TdTomato. The top row shows a small portion of an axon branch bearing two boutons (TdTomato) containing syn-GFP puncta (left) and the merged view (right). The kymographs show the dynamic changes of syn-GFP and TdTomato signal in the two boutons in a 800-s movie with 20 s interval. Each horizontal line in the kymograph represents the signal from one time point. Note the moment-to-moment correspondence of signal fluctuations in syn-GFP and TdTomato (black arrows). The bottom right panel shows a schematic of the dynamic changes in (G).
Figure 2
Figure 2
Dynamic behavior of syn-GFP puncta among neighboring boutons in developing GABAergic axons. PV basket neurons were transfected with LSL-syn-GFP and LSL-DsRed in slice cultures from PV-ires-Cre mice and their axon terminals were imaged for 1 h at 1 min interval. (A) A “recur” puncta which disappear (red arrow) and appear (green arrow) within several minutes. (B) A “Disappear” puncta. (C) A “New” puncta. (D–E) For the recur puncta events in Figure 2D, the distribution of “ON” and “OFF” duration was plotted and fitted with y = a × exp(−x/b) function (blue dots, raw data; red line, fitted line). (F) For each “recur” puncta, the appearance (ON) and the following disappearance (OFF) duration was plotted for each episode. The linear regression was applied for the data and the R2 was shown (45 data points from five cells). There was no correlation between the length of ON and OFF duration (P = 0.68, ANOVA regression analysis). (G) Two neighboring syn-GFP puncta showing reciprocal changes in intensity in tens of minutes. (H) Changes in syn-GFP signal at two neighboring sites in (G) were plotted with time (blue and red curves). The correlation of changes between the two sites was also plotted (black curve; see Materials and Methods).
Figure 3
Figure 3
The strength of GABA transmission regulates the stability of nascent syn-GFP puncta. Cortical slice cultures of GAD67flx/flx mice were biolistically transfected at ∼EP15 with PG67-syn-GFP and PG67-TdTomato. GAD67 overexpression (OE) was achieved by including an additional PG67-Gad67 construct. Single basket cell GAD67 knockout was achieved by including an additional PG67-Cre construct. (A) Sparsely labeled basket neurons were imaged at EP18-20 at 15 min interval for 1 h. Representative images of the first half hour were shown. Red arrows indicate the disappeared puncta, and green arrows indicate appeared and persistent puncta. (B) The percentage of lost puncta was analyzed as described in the Section “Materials and Methods.” (KO: 6 cells, 476 puncta; WT: 5 cells, 565 puncta; OE: 4 cells, 406 puncta; one-way ANOVA P = 0.006, post hoc Dunn’s test, *p < 0.05) (C) The syn-GFP puncta size vs. signal intensity for all puncta (blue dots) and for lost puncta (red dots) in WT basket cells (565 puncta for all puncta, 39 lost puncta). Linear regression was applied for both groups and R2 were displayed. (D) The size of all syn-GFP puncta and lost puncta of WT cells was binned. The number of lost puncta in each category was divided by the number of total syn-GFP puncta in that category to derive the percentage of lost puncta in that category. The red line is the fitted curve with function y = a × exp(−x/b). (E) The intensity of all syn-GFP puncta and lost puncta was binned with arbitrary unit. The number of lost puncta in each category was divided by the number of total puncta in that category to calculate the percentage of lost puncta. The red line is the fitted curve with function y = a × exp(−x/b). (F) Both the whole syn-GFP puncta population and the lost puncta population were classified according to their size. The percentage of lost puncta in each category was determined as the number of lost puncta in that category divided by the number of total puncta in that category. Significant change was only found in the <29-pixels group (one-way ANOVA P = 0.0002, post hoc Dunn’s test, *p < 0.05).
Figure 4
Figure 4
GABABR in basket cells regulates the stability of nascent syn-GFP puncta. (A) Scheme of imaging experiments with drug treatment. (B) Acute baclofen (10 μM) treatment rescued unstable syn-GFP puncta in GAD67−/− cells transfect with the PG67-Cre construct using slice cultures from GAD67flx/flx mice. Representative images at the indicated time points of the same set of puncta were shown. Red arrows and green arrows indicate the disappeared puncta and the present puncta, respectively. (C) The percentage of lost puncta was quantified for both WT and GAD67−/− KO basket neurons under control condition and baclofen treatment (n = 7 cells, t-test P = 0.002 for KO, P = 0.026 for WT, comparing with corresponding control group). (D) Using slice cultures from PV-ires-Cre mice, PV basket neurons labeled by LSL-syn-GFP and LSL-DsRed were imaged first under control condition and then under 10 μM CGP treatment. The percentage of lost puncta was quantified (n = 6 cells, t-test P = 0.002). (E) Bouton dynamics did not change significantly during the second 1 h imaging session under control condition. Cortical PV neurons were labeled with LSL-syn-GFP and LSL-DsRed using slice cultures from PV-ires-Cre mice. The two imaging sessions were conducted as depicted in the diagram, and the lost syn-GFP puncta were quantified (n = 3 cells). (F) CGP treatment did not significantly quench fluorescence protein signal. For neurons analyzed in (D,E), syn-GFP and RFP intensity on 10 randomly picked boutons were followed for all time points. The change of fluorescence levels on the same bouton was analyzed by normalizing with the initial fluorescence signal, which was normalized as 100. (G) For neurons imaged in (D), the percentage of lost puncta was plotted according to their size described in Figure 3F (n = 6 cells, t-test P = 0.001). (H) Acute CGP treatment did not change the puncta size distribution. For neurons analyzed in Figure 4D, puncta were classified according to size. The fraction of each size category over the whole puncta population was calculated and plotted. The analysis was done for the 30- and 180-min time points, according to the X axis in (F) (n = 3 cells).
Figure 5
Figure 5
Presynaptic GABABR in basket cells regulates the stability of nascent syn-GFP puncta. (A) Slice cultures of GABAB1flx/flx mice were biolistically transfected at ∼EP15 with PGAD67-syn-GFP and PGAD67-TdTomato. Single basket cell GABAB1 knockout was achieved by including an additional PGAD67-Cre construct. Labeled neurons were imaged first under control condition and then under CGP treatment. The percentage of lost puncta was quantified (n = 4). (B) Slice cultures from GABAB1flx/flx::PV-ires-Cre mice in which GABAB1 was deleted in all PV neurons were used. PV neurons were labeled by co-transfection of LSL-syn-GFP and LSL-DsRed constructs and their axons were imaged under control condition. The percentage of lost puncta was quantified (n = 5 cells for both, t-test P = 0.03). (C) For neurons imaged in (B), the percentage of recur puncta (see Materials and Methods) was quantified (n = 5 cells, t-test P = 0.04). (D) For neurons imaged in (B), the number of episodes for each recur puncta was analyzed (n = 5 cells, t-test P = 0.03). (E) For all the observed episodes, the duration of appearance and disappearance were quantified (n = 129 puncta for KO; n = 45 for WT).
Figure 6
Figure 6
Presynaptic GABABR locally modulates actin polymerization in GABAergic boutons. Slice cultures from PV-ires-Cre mice were transfected at ∼EP15 with LSL-actin-CFP and LSL-actin-YFP to express this FRET pairs in PV neurons. Labeled neurons were imaged at EP18–20. (A) Representative heat-maps of FRET level in the same bouton under control condition and after 30 min treatment of 10 μM CGP46381 (CGP). Warmer color indicates higher FRET level. (B) The YFP/CFP ratio of 24 randomly chosen boutons (gray lines) from three different cells was quantified before and after 30 min CGP treatment. Red line is the average across all boutons. CGP treatment reduced YFP/CFP ratio. (C) When normalized with YFP/CFP ratio under control condition, CGP reduced YFP/CFP ratio by 17.6 ± 5.8% (paired t-test P = 0.004; n = 24 from four cells). (D–G) GABAB−/− PV neurons in GABAB1flx/flx::PV-ires-Cre slice cultures were labeled by LSL-actin-YFP and LSL-actin-CFP. The change in YFP/CFP ratio of each bouton was followed under different drug treatments as indicated (gray lines). Red line is the average across all boutons. Latrunculin A (10 μM, 10 min) or Jasplakinolide (10 μM, 15 min) was added under the presence of CGP. Percent changes in YFP/CFP ratio were normalized to control condition (n = 12 from three cells; one-way repeated measures ANOVA, Bonferroni post hoc test, P < 0.005 for Lat vs. CGP, P < 0.01 for Jas vs. CGP). (H) Representative image of two-photon imaging-guided placement of iontophoresis pipette tip to close vicinity of a single bouton. (I) The change of FRET level after focal iontophoresis of GABA, plotted against the distance between individual bouton and pipette tip (n = 6 cells for both WT and KO). Solid lines are fitted curve with y = a × exp(−x/b).
Figure 7
Figure 7
Actin polymerization levels influence syn-GFP puncta stability in GABA axons. (A–B) PV neurons in PV-ires-Cre slice cultures were co-transfected with LSL-syn-GFP and LSL-cofilin(S3A)-mCherry (A) or LSL-cofilin(S3D)-mCherry (B) between EP15–17. Labeled neurons were imaged for 1 h at 1 min interval between EP20–22. Red arrows and green arrows indicate disappeared puncta and present puncta, respectively. (C-D) GABAB1−/− PV neurons in GABAB1flx/flx::PV-ires-Cre cultures were transfected with LSL-syn-GFP, together with either LSL-mCherry (C) or LSL-cofilin(S3D)-mCherry (D), and were imaged for 1 h at 1 min interval between P19–21. (E) Labeled neurons in (A) and (B) were imaged first under control (Ctrl) and then under indicated drug treatment. Lost puncta in both control and indicated drug treatments were quantified (n = 4 cells for each group). (F) Lost puncta in (C) and (D), as well as that of WT PV neurons from slice cultures from sibling GABAB1+/+::PV-ires-Cre mice were quantified. The value of KO and WT were re-plotting of Figure 5B (n = 5 cells for each group; one-way ANOVA, post hoc Dunn’s test, P = 0.01 for KO vs. KO S3D). (G–H) Actin depolymerization resulted in increased population of small syn-GFP puncta. Cortical PV neurons were transfected with LSL-syn-GFP, as well as either LSL-cofilin(S3A)-mCherry or LSL-cofilin(S3D)-mCherry using slice cultures from PV-ires-Cre mice at EP15–17. Bouton size was analyzed at EP20. (G) The distribution of different size population of syn-GFP puncta of S3A and S3D transfected neurons (n = 5). (H) Cumulative distribution of all puncta of S3A and S3D transfected neurons, showing significant divergence for puncta smaller than 1 μm (K-S test, P < 0.0001).
Figure 8
Figure 8
Blocking GABABR signaling in PV neurons resulted in lower bouton density and less axon branching both in vitro and in vivo. (A) PV neurons from PV-ires-Cre slice cultures were labeled by LSL-YFP. Slices were treated with CGP from EP14 and fixed at EP19. Inserts show NeuN immunostaining of pyramidal neuron soma (red). (B) The axon morphology of PV neurons in (A) were reconstructed and analyzed (n = 3 cells for each group). (C) To delete GABABR in single basket neurons, slice cultures from GABAB1flx/flx mice were transfected with PG67-Cre and PG67-GFP at EP15, and control basket cells were transfected with PG67-GFP. Slices were fixed at EP19. (D) The axon morphology of neurons in (C) were reconstructed and analyzed (n = 3 cells for each group). (E) AAV-LSL-DsRed virus was injected into the visual cortex of GABAB1+/+::PV-ires-Cre or GABAB1flx/flx::PV-ires-Cre mice at P30 to label PV basket neurons. Acute visual cortical slices were prepared at P40 and RFP labeled PV neurons were patch clamped and filled with biocytin. Biocytin loaded PV neurons were fixed and immunostained for biocytin. The stained neurons were imaged by confocal microscopy and the axon morphology was reconstructed using Neurolucida. (F) Mice of indicated genotypes were sacrificed and perfused at P40. Coronal sections were immunostained for PV in red. Layer 2/3 of visual cortex was imaged. Arrows indicate the perisomatic PV cell axon terminals. The middle panel shows the lower magnification view of visual cortex stained for PV in red. The number of PV positive neurons was quantified and showed no difference between WT and GABABR KO samples (n = 15 regions from three animals). (G) The bouton density and axon branching of neurons in (E) were fully reconstructed and analyzed (nine WT neurons, eight KO neurons; *P < 0.03).
Figure 9
Figure 9
GABABR deficiency in PV neurons results in aberrant density and size distribution of presynaptic terminals in vivo. (A) Morphology of axon branches and presynaptic boutons of control (left panels) and GABAB1−/− (right panels) PV neurons in layer 2/3 of visual cortex were labeled by biocytin at P40; mouse genotypes are as indicated. (B) The bouton density (# of bouton per μm) on different axon branch order was analyzed for all reconstructed neurons (*P < 0.05, comparing with WT neuron). (C) The average maximum axon branch order for all reconstructed neurons (*P = 0.01, n = 9 for WT, n = 8 for KO). (D) The size change of consecutive boutons along one axon branch was plotted for WT and GABAB1−/− KO PV cells. The average bouton size of each branch was normalized as 100%. The percentage of neighbor size change was calculated as described in the Section “Materials and Methods” and was plotted. Data were from 11 axons segments of three cells of both WT and KO neurons, which contained 268 boutons in WT axons and 246 boutons in KO axons (Student t-test, P < 0.0001). (E) Boutons of terminal axon branches of both WT and KO neurons were quantified, and the cumulative probability of bouton size distribution was plotted (332 boutons for WT, 328 boutons for KO; K-S test, P < 0.0001). (F) Sample traces of mIPSC recorded from layer 2/3 pyramidal neurons WT and GABABR KO animals. (G) Average mIPSC amplitude of all recorded neurons. (H) Average mIPSC frequency of all recorded neurons (n = 15 for each group, P = 0.02, five WT mice and five KO mice). (I) The cumulative distribution of mIPSC amplitude. (J) The cumulative distribution of mIPSC inter-event interval (K-S test, P < 0.001).
Figure 10
Figure 10
A model on the role of presynaptic GABABR in regulating the development of inhibitory synapses. A developing GABAergic axon (light blue) explores potential synaptic targets (beige rectangles) by making transient synaptic contacts. Beige rectangles represent appropriate targets; rectangles with lines represent inappropriate targets. These transient contacts contain release machinery, such as synaptic vesicles (green filled circles) that are mobile (arrows) along the axon and mediate GABA release (boxed inset). Autocrine GABA signaling through presynaptic GABABR promotes actin polymerization likely through G protein signaling and stabilizes mobile synaptic vesicles at the developing terminal. Through synaptic activity and GABABR dependent recruitment and redistribution of presynaptic resource (e.g., synaptic vesicles), contacts at the inappropriate targets are eliminated whereas those at the appropriate targets are validated and strengthened (WT). In the absence of GABABR (GABABR−/−), nascent contacts fail to stabilize mobile synaptic vesicle pools according to GABA release, leading to reduced bouton density and aberrant distribution along axon branch.
Figure A1
Figure A1
Imaging of neurons expressing either actin-CFP or actin-YFP alone to estimate the bleed-through between two channels under different excitation wave length. PV neurons in cortical slice culture were transfected with LSL-actin-CFP or LSL-actin-YFP at EP14. The labeled neuron was imaged with two-photon microscopy at EP18. Images were taken under different wavelength excitation indicated in the figure.

Similar articles

Cited by

References

    1. Ahmari S. E., Buchanan J., Smith S. J. (2000). Assembly of presynaptic active zones from cytoplasmic transport packets. Nat. Neurosci. 3, 445–45110.1038/74814 - DOI - PubMed
    1. Arber S., Barbayannis F. A., Hanser H., Schneider C., Stanyon C. A., Bernard O., et al. (1998). Regulation of actin dynamics through phosphorylation of cofilin by LIM-kinase. Nature 393, 805–80910.1038/31729 - DOI - PubMed
    1. Armbruster M., Ryan T. A. (2011). Synaptic vesicle retrieval time is a cell-wide rather than individual-synapse property. Nat. Neurosci. 14, 824–82610.1038/nn.2828 - DOI - PMC - PubMed
    1. Bettler B., Kaupmann K., Mosbacher J., Gassmann M. (2004). Molecular structure and physiological functions of GABA(B) receptors. Physiol. Rev. 84, 835–86710.1152/physrev.00036.2003 - DOI - PubMed
    1. Burrone J., Li Z., Murthy V. N. (2006). Studying vesicle cycling in presynaptic terminals using the genetically encoded probe synaptopHluorin. Nat. Protoc. 1, 2970–297810.1038/nprot.2006.449 - DOI - PubMed

LinkOut - more resources