. 2012 Dec 5:3:259.
doi: 10.3389/fpls.2012.00259. eCollection 2012.

Pitfalls and possibilities in the analysis of biomass allocation patterns in plants

Affiliations

Pitfalls and possibilities in the analysis of biomass allocation patterns in plants

Hendrik Poorter et al. Front Plant Sci. .

Abstract

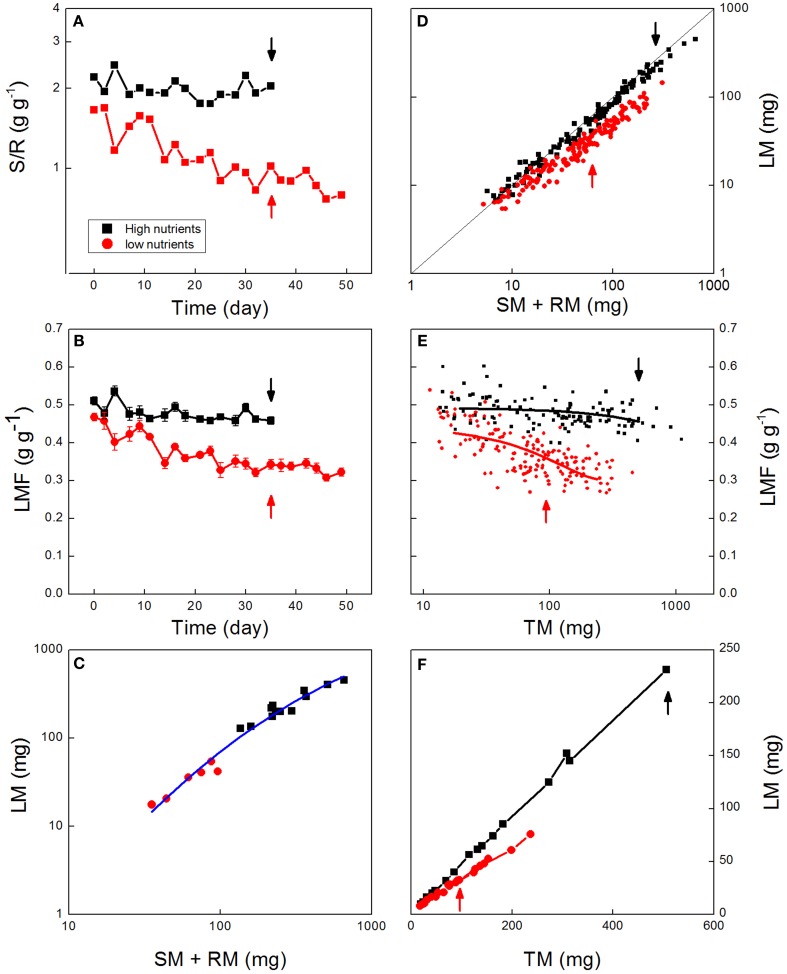
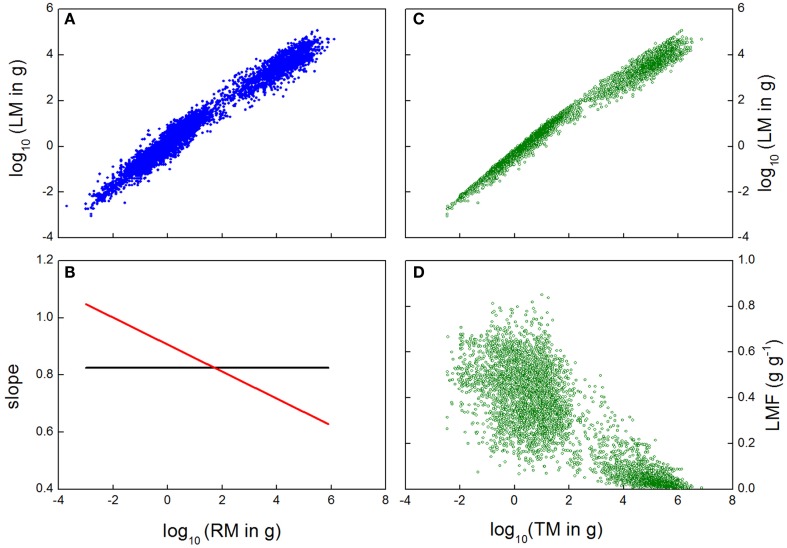
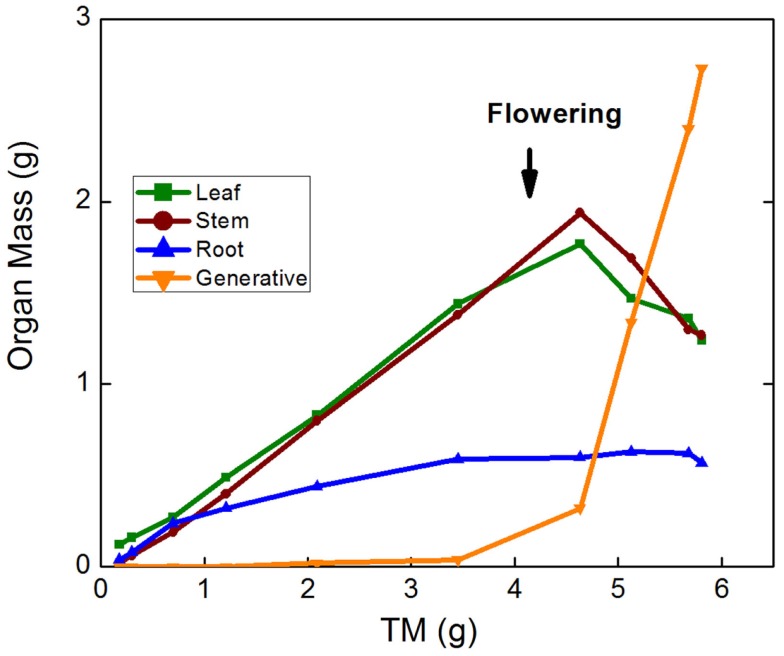
Plants can differentially allocate biomass to leaves, stems, roots, and reproduction, and follow ontogenetic trajectories that interact with the prevailing climate. Various methodological tools exist to analyze the resulting allocation patterns, based either on the calculation of biomass ratios or fractions of different organs at a given point in time, or on a so-called allometric analysis of biomass data sampled across species or over an experimental growth period. We discuss the weak and strong points of each of these methods. Although both approaches have useful features, we suggest that often a plot of biomass fractions against total plant size, either across species or in the comparison of treatment effects, combines the best of both worlds.

Keywords: allometry; biomass allocation; leaf mass fraction; methodology; shoot:root ratio.


Figures

Figure 1
Figure 1
Biomass allocation as affected by nutrient availability. Data are shown from an experiment with Deschampsia flexuosa as described by Poorter et al. (1995). Data for high-nutrient plants are given in black, for low-nutrient plants in red. (A) Shoot:root ratio over time (Each point is the average of six sampled plants, except in the first and last harvest where n = 12). (B) Leaf Mass Fraction (LMF) values averaged per harvest and plotted against time. (C) Leaf mass (LM) plotted against stem plus root mass (SM + RM) of plants harvested at day 35. Points represent values for individual plants, and the line is the allometric equation fitted through all data. (D) Leaf mass plotted against stem plus root mass for all individual plants harvested throughout the experiment. The line indicates the 1:1 relationship. (E) Leaf mass plotted against total plant mass (TM) for low-nutrient and high-nutrient plants. Points represent values for all the individuals harvested during the experiment, and lines show the fitted polynomial trends. (F) Leaf mass plotted against total plant mass throughout the experiment. Points represent averages per harvest. Arrows indicate the plants harvested at day 35. All biomass values are based on dried material.
Figure 2
Figure 2
(A) Log-transformed leaf mass (LM) plotted against log-transformed root mass (RM) for a wide range of species and growth conditions. (B) Slope of a linear (black) or quadratic (red) relationship fitted through the data of (A). (C) Log-transformed leaf mass data plotted against log-transformed total plant mass (TM), and (D) Leaf Mass Fraction (LMF) plotted against log-transformed total plant mass for the same observations. Data are from Poorter et al. (2012), and comprise a large dataset (n = ∼5230) of leaves, stems, and roots of herbaceous and woody species.
Figure 3
Figure 3
Leaf, stem, root, and reproductive mass of Pisum sativum plotted against total plant mass (TM). Plants were grown hydroponically in a growth room from the seedling to the generative stage (P. W. Wolswinkel and T. L. Pons, pers. comm.).

References

    1. Bernacchi C. J., Coleman J. S., Bazzaz F. A., McConnaughay K. D. M. (2000). Biomass allocation in old-field annual species grown in elevated CO2 environments: no evidence for optimal partitioning. Glob. Chang. Biol. 6, 855–86310.1046/j.1365-2486.2000.00370.x - DOI
    1. Bloom A. J., Chapin F. S., Mooney H. A. (1985). Resource limitation in plants – an economic analogue. Annu. Rev. Ecol. Syst. 16, 363–39210.1146/annurev.es.16.110185.002051 - DOI
    1. Brett M. T. (2004). When is a correlation between non-independent variables “spurious”? Oikos 105, 647–65610.1111/j.0030-1299.2004.12777.x - DOI
    1. Brouwer R. (1963). Some Aspects of the Equilibrium Between Overground and Underground Plant Parts. Jaarboek van het Instituut voor Biologisch en Scheikundig onderzoek aan Landbouwgewassen, Wageningen, 1963, 31–39
    1. Causton D. R., Venus J. (1981). The Biometry of Plant Growth. London: Edward Arnold

LinkOut - more resources