

Effects of cholesterol on nano-mechanical properties of the living cell plasma membrane
- PMID: 23227105
- PMCID: PMC3515074
- DOI: 10.1039/C2SM25263E
Effects of cholesterol on nano-mechanical properties of the living cell plasma membrane
Abstract
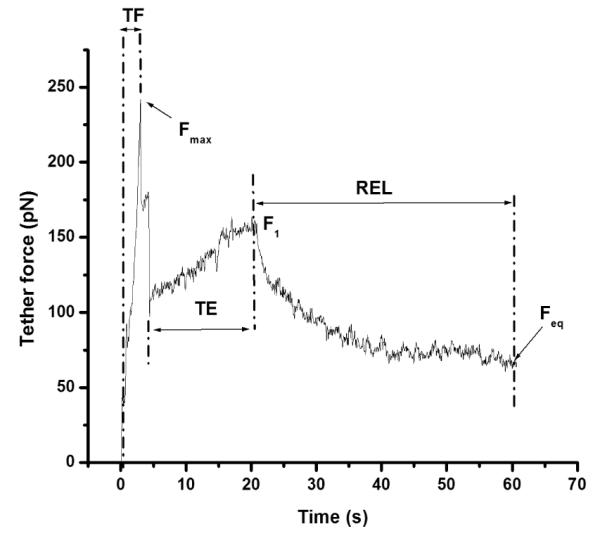
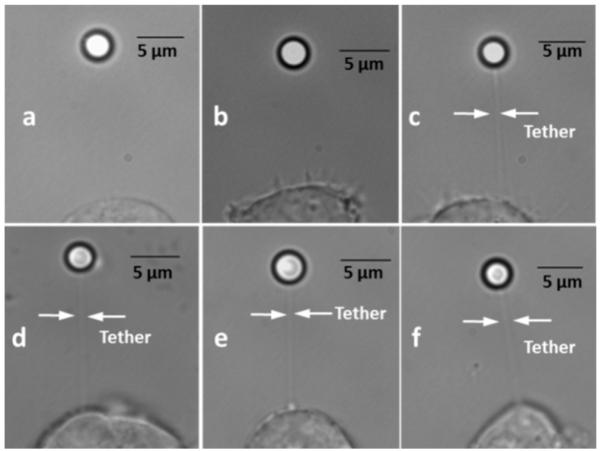
In this study, we investigated the effects of membrane cholesterol content on the mechanical properties of cell membranes by using optical tweezers. We pulled membrane tethers from human embryonic kidney cells using single and multi-speed protocols, and obtained time-resolved tether forces. We quantified various mechanical characteristics including the tether equilibrium force, bending modulus, effective membrane viscosity, and plasma membrane-cytoskeleton adhesion energy, and correlated them to the membrane cholesterol level. Decreases in cholesterol concentration were associated with increases in the tether equilibrium force, tether stiffness, and adhesion energy. Tether diameter and effective viscosity increased with increasing cholesterol levels. Disruption of cytoskeletal F-actin significantly changed the tether diameters in both non-cholesterol and cholesterol-manipulated cells, while the effective membrane viscosity was unaffected by F-actin disruption. The findings are relevant to inner ear function where cochlear amplification is altered by changes in membrane cholesterol content.
Figures


Similar articles
-
Mechanical properties of neuronal growth cone membranes studied by tether formation with laser optical tweezers.Biophys J. 1995 Mar;68(3):988-96. doi: 10.1016/S0006-3495(95)80274-2. Biophys J. 1995. PMID: 7756561 Free PMC article.
-
Modeling the mechanics of tethers pulled from the cochlear outer hair cell membrane.J Biomech Eng. 2008 Jun;130(3):031007. doi: 10.1115/1.2907758. J Biomech Eng. 2008. PMID: 18532856
-
Effects of plasma membrane cholesterol level and cytoskeleton F-actin on cell protrusion mechanics.PLoS One. 2013;8(2):e57147. doi: 10.1371/journal.pone.0057147. Epub 2013 Feb 22. PLoS One. 2013. PMID: 23451167 Free PMC article.
-
Characteristics of a membrane reservoir buffering membrane tension.Biophys J. 1999 Oct;77(4):1992-2002. doi: 10.1016/S0006-3495(99)77040-2. Biophys J. 1999. PMID: 10512819 Free PMC article.
-
Cell membrane biophysics with optical tweezers.Eur Biophys J. 2018 Jul;47(5):499-514. doi: 10.1007/s00249-017-1268-9. Epub 2017 Nov 21. Eur Biophys J. 2018. PMID: 29164289 Review.
Cited by
-
Myelinating glia differentiation is regulated by extracellular matrix elasticity.Sci Rep. 2016 Sep 20;6:33751. doi: 10.1038/srep33751. Sci Rep. 2016. PMID: 27646171 Free PMC article.
-
The Role of Cytoskeleton Revealed by Quartz Crystal Microbalance and Digital Holographic Microscopy.Int J Mol Sci. 2022 Apr 7;23(8):4108. doi: 10.3390/ijms23084108. Int J Mol Sci. 2022. PMID: 35456926 Free PMC article.
-
Comparative study of methods to calibrate the stiffness of a single-beam gradient-force optical tweezers over various laser trapping powers.J Biomed Opt. 2014;19(11):115001. doi: 10.1117/1.JBO.19.11.115001. J Biomed Opt. 2014. PMID: 25375348 Free PMC article.
-
Bioactive cell-like hybrids from dendrimersomes with a human cell membrane and its components.Proc Natl Acad Sci U S A. 2019 Jan 15;116(3):744-752. doi: 10.1073/pnas.1811307116. Epub 2018 Dec 27. Proc Natl Acad Sci U S A. 2019. PMID: 30591566 Free PMC article.
-
Mechanical transduction by ion channels: A cautionary tale.World J Neurol. 2015 Sep 28;5(3):74-87. doi: 10.5316/wjn.v5.i3.74. World J Neurol. 2015. PMID: 28078202 Free PMC article.
References
-
- Alberts B, Johnson A, Lewis J, Raff M, Roberts K, Walter P. Molecular biology of the cell. 4th edition Garland Science; New York: 2002.
-
- Emmelot P. mammalian cell membranes. Vol. 2. Butterworths; London: 1977.
-
- Hinzpeter A, Fritsch J, Borot F, Trudel S. p., Vieu D-L, Brouillard F, Baudouin-Legros M, Clain J. r. m., Edelman A, Ollero M. Membrane cholesterol content modulates CIC-2 gating and sensitivity to oxidative stress. J.Biol.Chem. 2007;282:2423–2432. - PubMed
-
- Pucadyil TJ, Chattopadhyay A. Role of cholesterol in the function and organization of G-protein coupled receptor. Prog. Lip. Res. 2006;45:295–333. - PubMed
Grants and funding
LinkOut - more resources
Full Text Sources