

Spreading out muscle mass within a Hill-type model: a computer simulation study
- PMID: 23227110
- PMCID: PMC3512296
- DOI: 10.1155/2012/848630
Spreading out muscle mass within a Hill-type model: a computer simulation study
Abstract
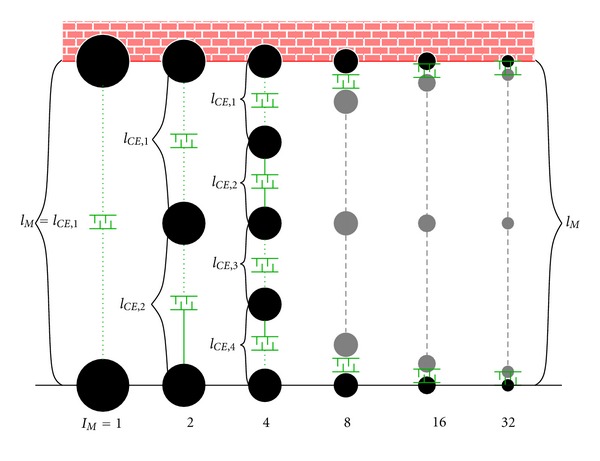
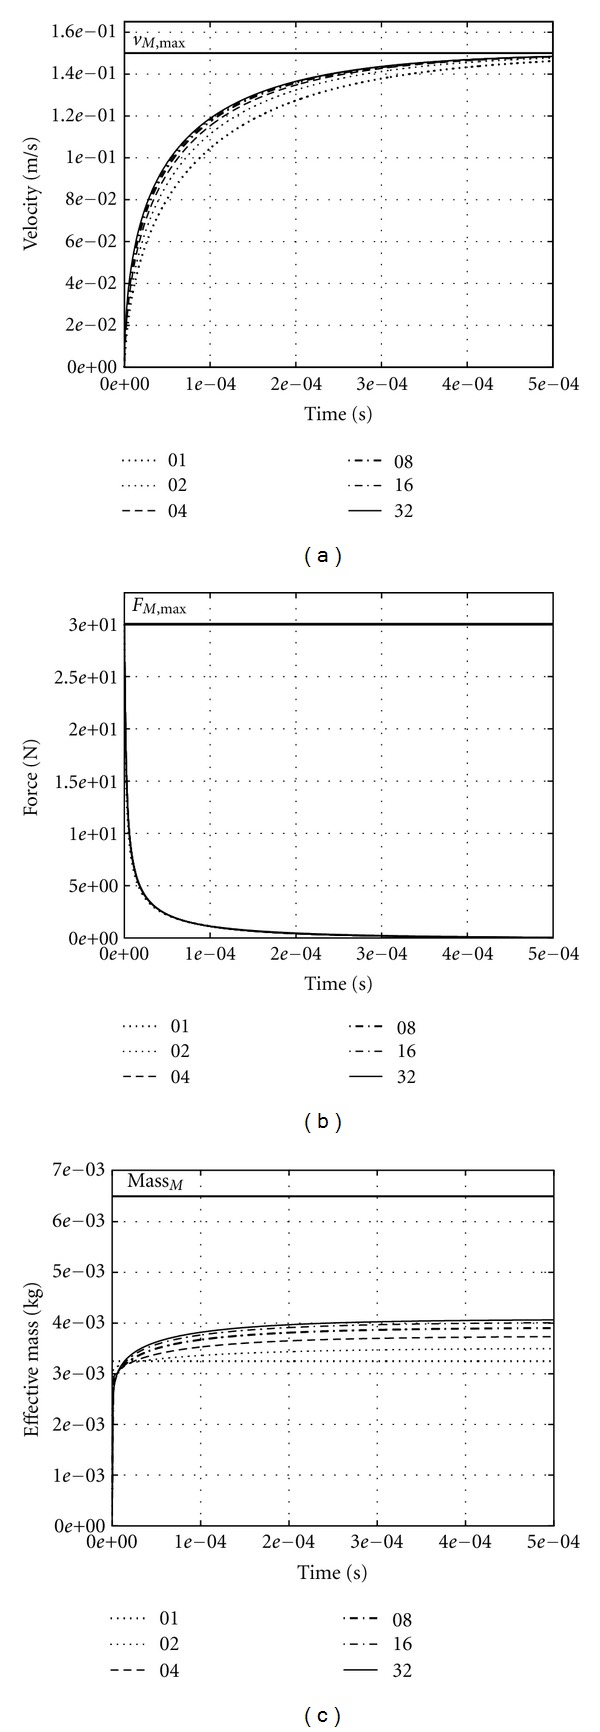
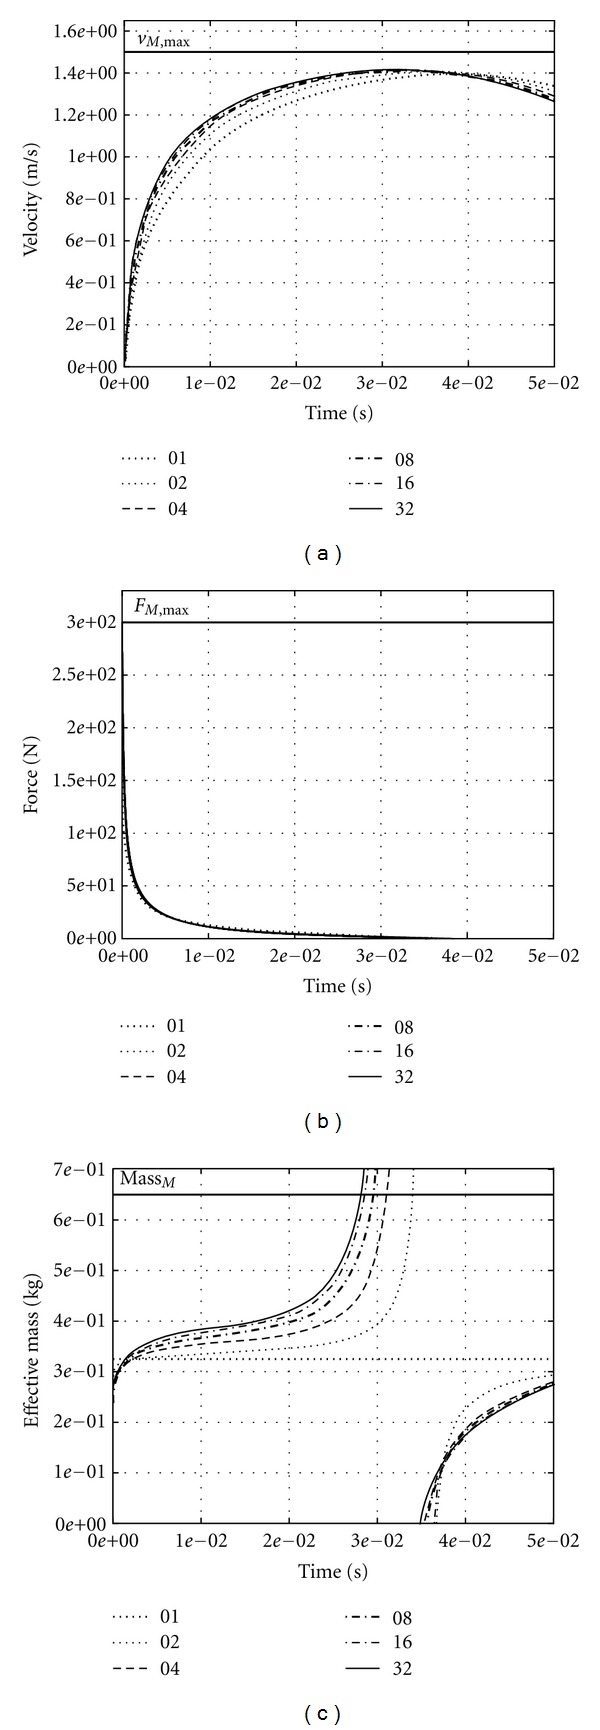
It is state of the art that muscle contraction dynamics is adequately described by a hyperbolic relation between muscle force and contraction velocity (Hill relation), thereby neglecting muscle internal mass inertia (first-order dynamics). Accordingly, the vast majority of modelling approaches also neglect muscle internal inertia. Assuming that such first-order contraction dynamics yet interacts with muscle internal mass distribution, this study investigates two questions: (i) what is the time scale on which the muscle responds to a force step? (ii) How does this response scale with muscle design parameters? Thereto, we simulated accelerated contractions of alternating sequences of Hill-type contractile elements and point masses. We found that in a typical small muscle the force levels off after about 0.2 ms, contraction velocity after about 0.5 ms. In an upscaled version representing bigger mammals' muscles, the force levels off after about 20 ms, and the theoretically expected maximum contraction velocity is not reached. We conclude (i) that it may be indispensable to introduce second-order contributions into muscle models to understand high-frequency muscle responses, particularly in bigger muscles. Additionally, (ii) constructing more elaborate measuring devices seems to be worthwhile to distinguish viscoelastic and inertia properties in rapid contractile responses of muscles.
Figures
Similar articles
-
Frequency domain-based models of skeletal muscle.J Electromyogr Kinesiol. 1998 Apr;8(2):79-91. doi: 10.1016/s1050-6411(97)00024-2. J Electromyogr Kinesiol. 1998. PMID: 9680948
-
Frequency response to rat gastrocnemius medialis in small amplitude vibrations.J Biomech. 1994 Aug;27(8):1015-22. doi: 10.1016/0021-9290(94)90218-6. J Biomech. 1994. PMID: 8089156
-
Extracting low-velocity concentric and eccentric dynamic muscle properties from isometric contraction experiments.Math Biosci. 2016 Aug;278:77-93. doi: 10.1016/j.mbs.2016.06.005. Epub 2016 Jun 16. Math Biosci. 2016. PMID: 27321191
-
Validation of Hill-type muscle models in relation to neuromuscular recruitment and force-velocity properties: predicting patterns of in vivo muscle force.Integr Comp Biol. 2014 Dec;54(6):1072-83. doi: 10.1093/icb/icu070. Epub 2014 Jun 12. Integr Comp Biol. 2014. PMID: 24928073 Free PMC article. Review.
-
Human muscle modelling from a user's perspective.J Electromyogr Kinesiol. 1998 Apr;8(2):119-24. doi: 10.1016/s1050-6411(97)00028-x. J Electromyogr Kinesiol. 1998. PMID: 9680952 Review.
Cited by
-
A multiscale chemo-electro-mechanical skeletal muscle model to analyze muscle contraction and force generation for different muscle fiber arrangements.Front Physiol. 2014 Dec 23;5:498. doi: 10.3389/fphys.2014.00498. eCollection 2014. Front Physiol. 2014. PMID: 25566094 Free PMC article.
-
Traditional graft preparation decreases physiologic responses, diminishes viscoelasticity, and reduces cellular viability of the conduit: A porcine saphenous vein model.Vasc Med. 2016 Oct;21(5):413-421. doi: 10.1177/1358863X16649040. Epub 2016 May 23. Vasc Med. 2016. PMID: 27216870 Free PMC article.
-
Muscle shortening velocity depends on tissue inertia and level of activation during submaximal contractions.Biol Lett. 2016 Jun;12(6):20151041. doi: 10.1098/rsbl.2015.1041. Biol Lett. 2016. PMID: 27354711 Free PMC article.
-
Characterization of Electromechanical Delay Based on a Biophysical Multi-Scale Skeletal Muscle Model.Front Physiol. 2019 Oct 9;10:1270. doi: 10.3389/fphys.2019.01270. eCollection 2019. Front Physiol. 2019. PMID: 31649554 Free PMC article.
-
Unregulated saphenous vein graft distension decreases tissue viscoelasticity.Perfusion. 2017 Sep;32(6):489-494. doi: 10.1177/0267659117697814. Epub 2017 Mar 9. Perfusion. 2017. PMID: 28820033 Free PMC article.
References
-
- Hill AV. The heat of shortening and the dynamic constants of muscle. Proceedings of the Royal Society of London B. 1938;126(843):136–195. - PubMed
-
- McMahon TA. Muscles, Reflexes, and Locomotion. Princeton, NJ, USA: Princeton University Press; 1984.
-
- Needham DM. Machina Carnis: The Biochemistry of Muscular Contraction in Its Historical Development. Cambridge, Mass, USA: Cambridge University Press; 1971.
-
- Kardel T. Niels Stensen’s geometrical theory of muscle contraction (1667): a reappraisal. Journal of Biomechanics. 1990;23(10):953–965. - PubMed
Publication types
MeSH terms
LinkOut - more resources
Full Text Sources
