

Tracing the invasion of the mediterranean land snail Cornu aspersum aspersum becoming an agricultural and garden pest in areas recently introduced
- PMID: 23227148
- PMCID: PMC3515588
- DOI: 10.1371/journal.pone.0049674
Tracing the invasion of the mediterranean land snail Cornu aspersum aspersum becoming an agricultural and garden pest in areas recently introduced
Abstract
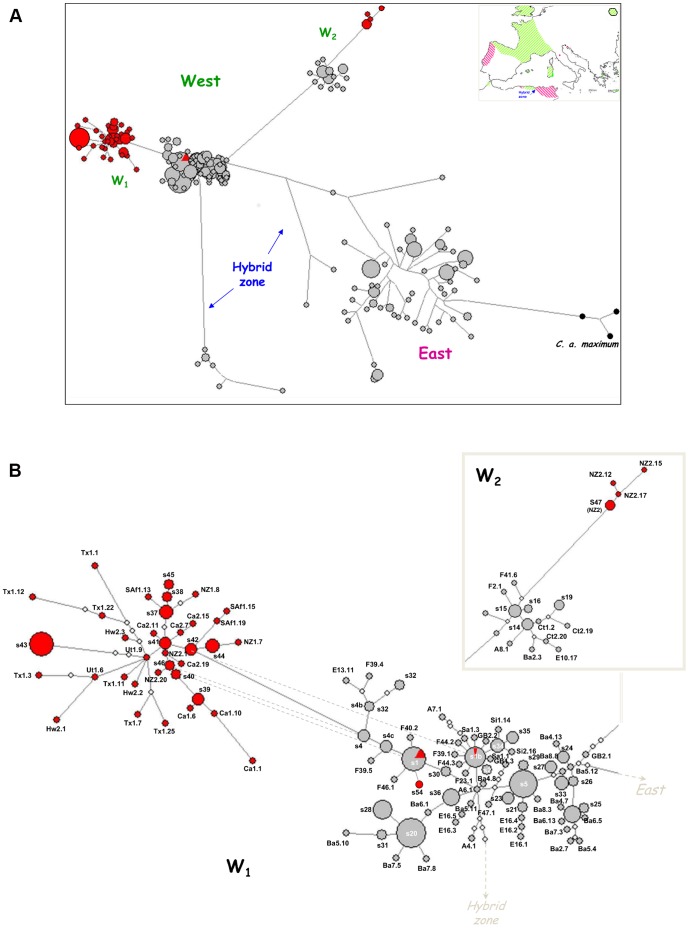
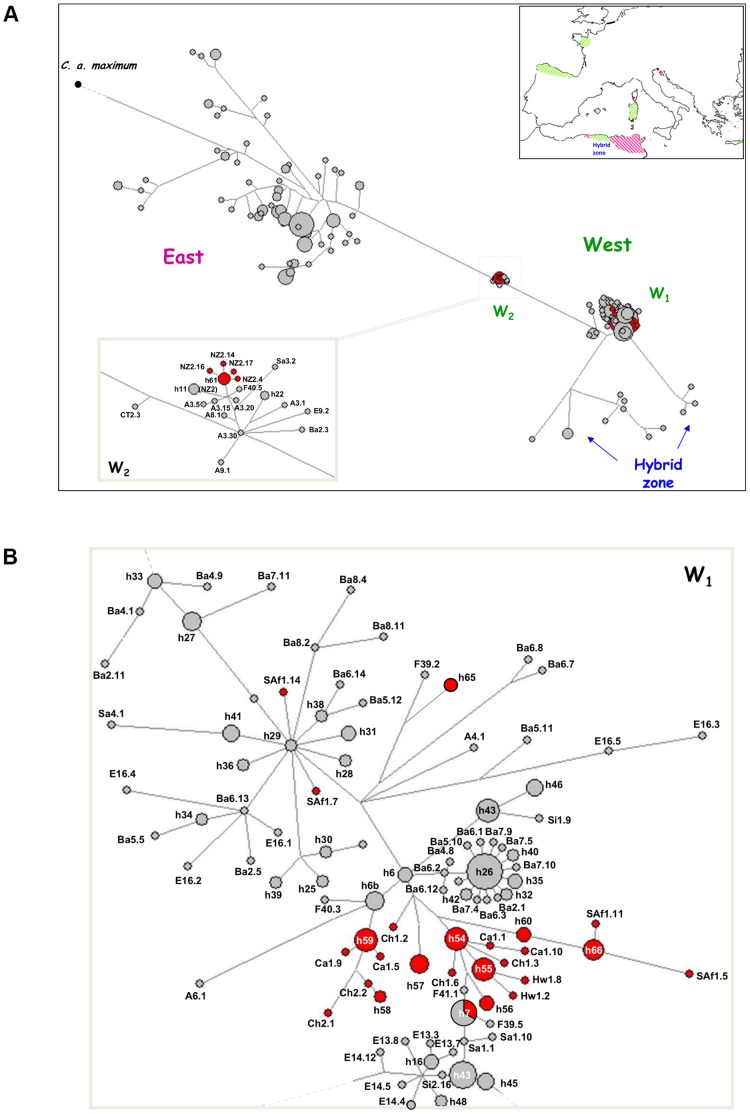
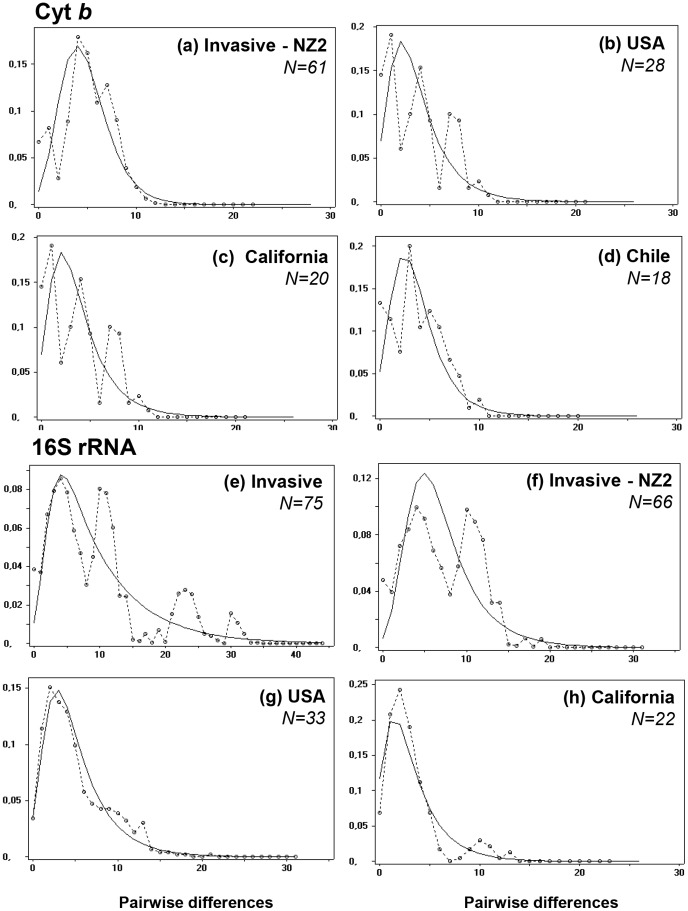
This study is the first on the genetics of invasive populations of one of the most widely spread land mollusc species known in the world, the "Brown Snail" Cornu aspersum aspersum. Deliberately or accidentally imported, the species has become recently a notorious pest outside its native Mediterranean range. We compared the spatial structure and genetic variability of invasive (America, Oceania, South Africa) versus native populations using five microsatellite loci and mitochondrial (Cyt b and 16S rRNA) genes as a first step towards (i) the detection of potential source populations, and (ii) a better understanding of mechanisms governing evolutionary changes involved in the invasion process. Results based on multivariate analysis (Discriminant Analysis of Principal Components), Bayesian statistical inference (Clustering, Approximate Bayesian Computation) and demographic tests allowed a construction of the introduction pathways of the species over recent centuries. While emigrants originated from only one of the two native lineages, the West one, the most likely scenario involved several introduction events and "source switching" comprising (i) an early stage (around 1660) of simultaneous introductions from Europe (France, Spain) towards Oceania (New Zealand) and California, (ii) from the early 18(th) century, a second colonization wave from bridgehead populations successfully established in California, (iii) genetic admixture in invasive areas where highly divergent populations came into contact as in New Zealand. Although these man-made pathways are consistent with historical data, introduction time estimates suggest that the two putative waves of invasion would have occurred long before the first field observations recorded, both in America and in Oceania. A prolonged lag period as the use of an incorrect generation time could explain such 100-150 years discrepancy. Lastly, the contrasting patterns of neutral genetic signal left in invasive populations are discussed in light of possible ways of facing novel environments (standing genetic variation versus new mutation).
Conflict of interest statement
Figures


Similar articles
-
Historical biogeography of the land snail Cornu aspersum: a new scenario inferred from haplotype distribution in the Western Mediterranean basin.BMC Evol Biol. 2010 Jan 20;10:18. doi: 10.1186/1471-2148-10-18. BMC Evol Biol. 2010. PMID: 20089175 Free PMC article.
-
Refining the biogeographical scenario of the land snail Cornu aspersum aspersum: Natural spatial expansion and human-mediated dispersal in the Mediterranean basin.Mol Phylogenet Evol. 2018 Mar;120:218-232. doi: 10.1016/j.ympev.2017.12.018. Epub 2017 Dec 13. Mol Phylogenet Evol. 2018. PMID: 29247848
-
Tracking invasion histories in the sea: facing complex scenarios using multilocus data.PLoS One. 2012;7(4):e35815. doi: 10.1371/journal.pone.0035815. Epub 2012 Apr 24. PLoS One. 2012. PMID: 22545140 Free PMC article.
-
Brachylaima spp. (Trematoda) parasitizing Cornu aspersum (Gastropoda) in France with potential risk of human consumption.Parasite. 2020;27:15. doi: 10.1051/parasite/2020012. Epub 2020 Mar 13. Parasite. 2020. PMID: 32167465 Free PMC article.
-
Edible Snail Production in Europe.Animals (Basel). 2022 Oct 11;12(20):2732. doi: 10.3390/ani12202732. Animals (Basel). 2022. PMID: 36290118 Free PMC article. Review.
Cited by
-
The Influence of Temperature on the Larval Development of Aelurostrongylus abstrusus in the Land Snail Cornu aspersum.Pathogens. 2021 Jul 29;10(8):960. doi: 10.3390/pathogens10080960. Pathogens. 2021. PMID: 34451424 Free PMC article.
-
Canine angiostrongylosis: recent advances in diagnosis, prevention, and treatment.Vet Med (Auckl). 2014 Dec 1;5:181-192. doi: 10.2147/VMRR.S53641. eCollection 2014. Vet Med (Auckl). 2014. PMID: 32670858 Free PMC article. Review.
-
Acetylcholinesterase-like proteins are a major component of reproductive trail mucus in the invasive pest land snail, Theba pisana.PLoS One. 2025 May 21;20(5):e0323380. doi: 10.1371/journal.pone.0323380. eCollection 2025. PLoS One. 2025. PMID: 40397853 Free PMC article.
-
Cardio-Pulmonary Parasitic Nematodes Affecting Cats in Europe: Unraveling the Past, Depicting the Present, and Predicting the Future.Front Vet Sci. 2014 Oct 9;1:11. doi: 10.3389/fvets.2014.00011. eCollection 2014. Front Vet Sci. 2014. PMID: 26664917 Free PMC article. Review.
-
Misperceived invasion: the Lusitanian slug (Arion lusitanicus auct. non-Mabille or Arion vulgaris Moquin-Tandon 1855) is native to Central Europe.Evol Appl. 2014 Jun;7(6):702-13. doi: 10.1111/eva.12177. Epub 2014 Jun 17. Evol Appl. 2014. PMID: 25067951 Free PMC article.
References
-
- Allendorf FW, Lundquist LL (2003) Introduction: population biology, evolution, and control of invasive species. Conserv Biol 17: 24–30.
-
- Lee CE (2002) Evolutionary genetics of invasive species. Trends Ecol Evol 17: 386–391.
-
- Jenkins C, Stephen RK (2011) A phylogenetic comparative study of preadaptation for invasiveness in the genus Silene (Caryophyllaceae). Biol Invasions 13: 1471–1486.
-
- Müller J (2001) Invasion history and genetic population structure of riverine macroinvertebrates. Zoology 104: 346–355. - PubMed
Publication types
MeSH terms
Substances
LinkOut - more resources
Full Text Sources
Molecular Biology Databases
Research Materials
