Sonic Hedgehog-signalling patterns the developing chicken comb as revealed by exploration of the pea-comb mutation
- PMID: 23227218
- PMCID: PMC3515514
- DOI: 10.1371/journal.pone.0050890
Sonic Hedgehog-signalling patterns the developing chicken comb as revealed by exploration of the pea-comb mutation
Abstract
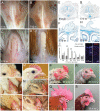
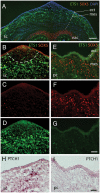
The genetic basis and mechanisms behind the morphological variation observed throughout the animal kingdom is still relatively unknown. In the present work we have focused on the establishment of the chicken comb-morphology by exploring the Pea-comb mutant. The wild-type single-comb is reduced in size and distorted in the Pea-comb mutant. Pea-comb is formed by a lateral expansion of the central comb anlage into three ridges and is caused by a mutation in SOX5, which induces ectopic expression of the SOX5 transcription factor in mesenchyme under the developing comb. Analysis of differential gene expression identified decreased Sonic hedgehog (SHH) receptor expression in Pea-comb mesenchyme. By experimentally blocking SHH with cyclopamine, the wild-type single-comb was transformed into a Pea-comb-like phenotype. The results show that the patterning of the chicken comb is under the control of SHH and suggest that ectopic SOX5 expression in the Pea-comb change the response of mesenchyme to SHH signalling with altered comb morphogenesis as a result. A role for the mesenchyme during comb morphogenesis is further supported by the recent finding that another comb-mutant (Rose-comb), is caused by ectopic expression of a transcription factor in comb mesenchyme. The present study does not only give knowledge about how the chicken comb is formed, it also adds to our understanding how mutations or genetic polymorphisms may contribute to inherited variations in the human face.
Conflict of interest statement
Figures


Similar articles
-
A genomic duplication is associated with ectopic eomesodermin expression in the embryonic chicken comb and two duplex-comb phenotypes.PLoS Genet. 2015 Mar 19;11(3):e1004947. doi: 10.1371/journal.pgen.1004947. eCollection 2015 Mar. PLoS Genet. 2015. PMID: 25789773 Free PMC article.
-
Copy number variation in intron 1 of SOX5 causes the Pea-comb phenotype in chickens.PLoS Genet. 2009 Jun;5(6):e1000512. doi: 10.1371/journal.pgen.1000512. Epub 2009 Jun 12. PLoS Genet. 2009. PMID: 19521496 Free PMC article.
-
The Rose-comb mutation in chickens constitutes a structural rearrangement causing both altered comb morphology and defective sperm motility.PLoS Genet. 2012 Jun;8(6):e1002775. doi: 10.1371/journal.pgen.1002775. Epub 2012 Jun 28. PLoS Genet. 2012. PMID: 22761584 Free PMC article.
-
Transcriptome analysis of comb and testis from Rose-comb Silky chicken (R1/R1) and Beijing Fatty wild type chicken (r/r).Poult Sci. 2017 Jun 1;96(6):1866-1873. doi: 10.3382/ps/pew447. Poult Sci. 2017. PMID: 28339981
-
Sequence analysis of a pea comb locus on chicken chromosome 1.Anim Genet. 2010 Dec;41(6):659-61. doi: 10.1111/j.1365-2052.2010.02048.x. Anim Genet. 2010. PMID: 20412124
Cited by
-
Analysis of the differentially expressed genes in the combs and testes of Qingyuan partridge roosters at different developmental stages.BMC Genomics. 2024 Jan 4;25(1):33. doi: 10.1186/s12864-024-09960-2. BMC Genomics. 2024. PMID: 38177997 Free PMC article.
-
Analysis of comb morphology in Sichuan Mountaineous Black-bone chickens and its correlation with growth performance.Poult Sci. 2025 Jul;104(7):105168. doi: 10.1016/j.psj.2025.105168. Epub 2025 Apr 17. Poult Sci. 2025. PMID: 40267567 Free PMC article.
-
Quantitative effect of a CNV on a morphological trait in chickens.PLoS One. 2015 Mar 13;10(3):e0118706. doi: 10.1371/journal.pone.0118706. eCollection 2015. PLoS One. 2015. PMID: 25768125 Free PMC article.
-
A genomic duplication is associated with ectopic eomesodermin expression in the embryonic chicken comb and two duplex-comb phenotypes.PLoS Genet. 2015 Mar 19;11(3):e1004947. doi: 10.1371/journal.pgen.1004947. eCollection 2015 Mar. PLoS Genet. 2015. PMID: 25789773 Free PMC article.
-
Development of external morphological malformations induced by hyperthermia exposure during the blastula stage in an ex-ovo (shell-less) culture of Gallus gallus domesticus embryos.Poult Sci. 2025 Aug;104(8):105341. doi: 10.1016/j.psj.2025.105341. Epub 2025 May 26. Poult Sci. 2025. PMID: 40446690 Free PMC article.
References
-
- Bateson W (1902) Experiments with poultry. Rep Evol Comm Roy Soc 1: 87–127.
-
- Stephenson JC (1915) Studies of the development of characteristics in normal and hybrid chicks. Washington University Studies 2: 47–77.
-
- Lawrence IE Jr (1971) Timed reciprocal dermal-epidermal interactions between comb, mid-dorsal, and tarsometatarsal. J Exp Zool 178: 195–209. - PubMed
-
- Lawrence IE Jr (1968) Regional influences on development of the single comb primordium. J Exp Zool 167: 263–273. - PubMed
Publication types
MeSH terms
Substances
LinkOut - more resources
Full Text Sources

