. 2013 Feb 22;425(4):767-79.
doi: 10.1016/j.jmb.2012.11.040. Epub 2012 Dec 7.

Characterization of the ribosome biogenesis landscape in E. coli using quantitative mass spectrometry

Affiliations

Characterization of the ribosome biogenesis landscape in E. coli using quantitative mass spectrometry

Stephen S Chen et al. J Mol Biol. .

Abstract

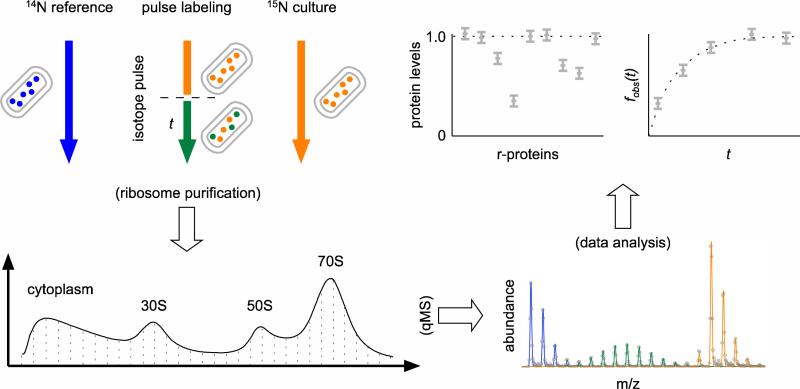
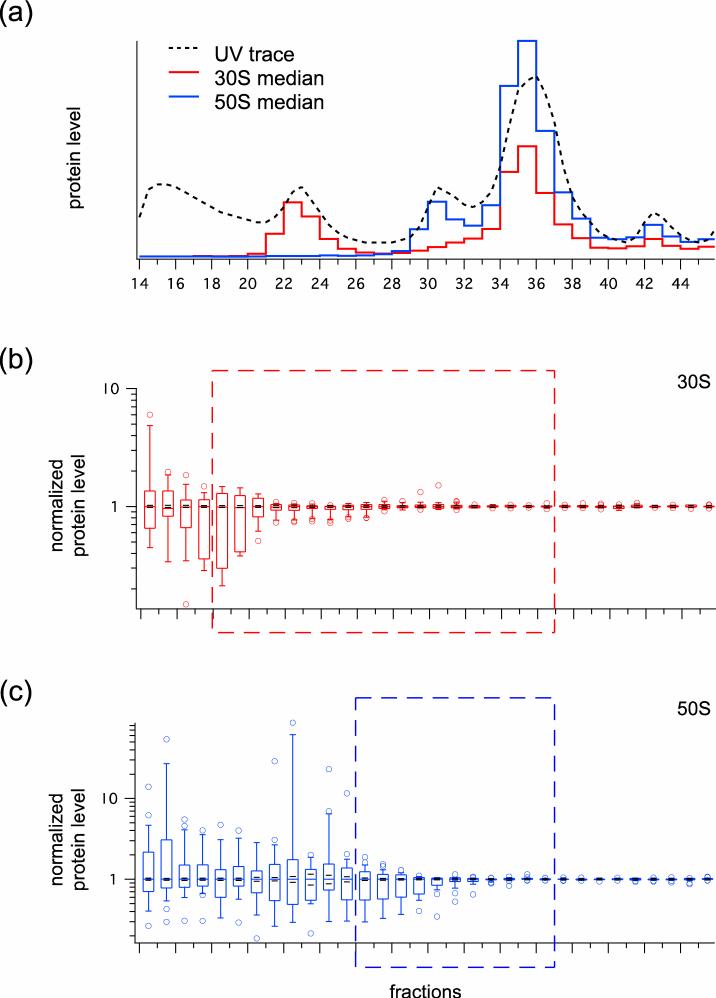
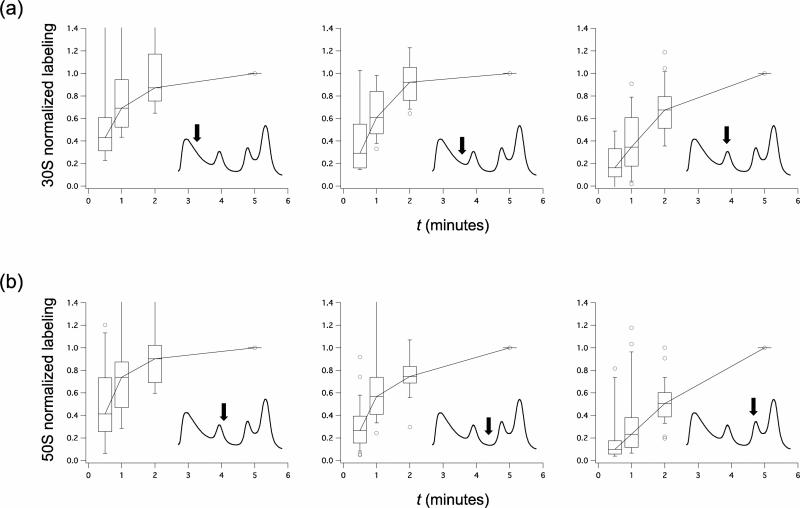
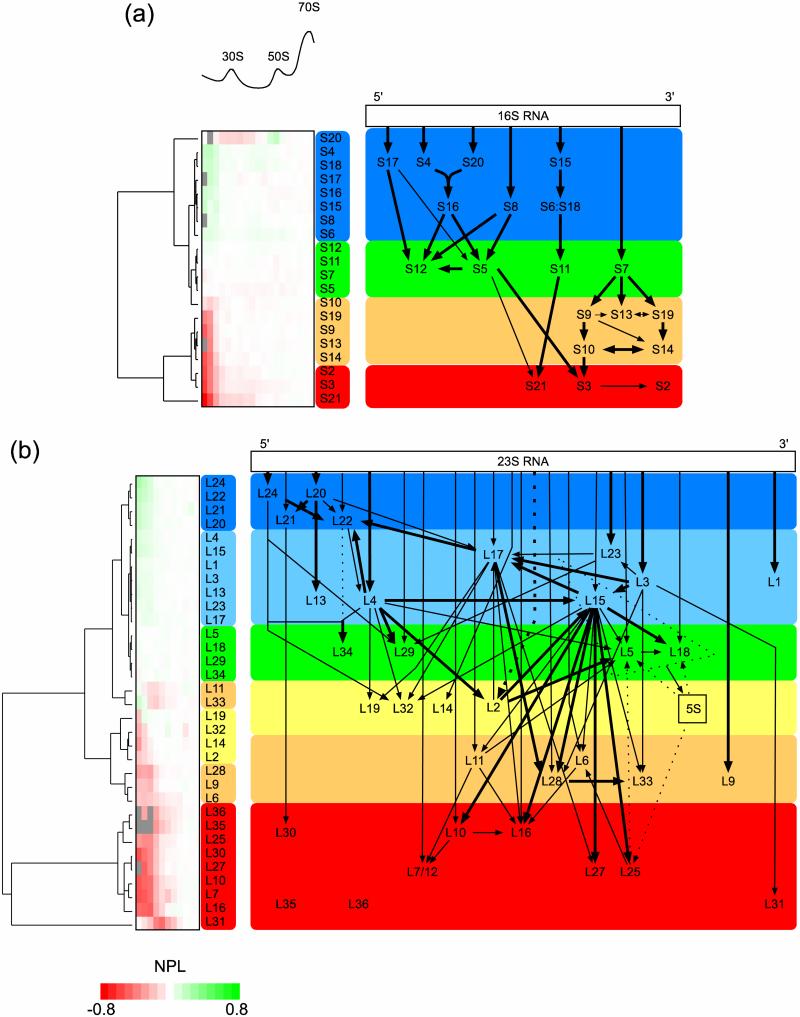
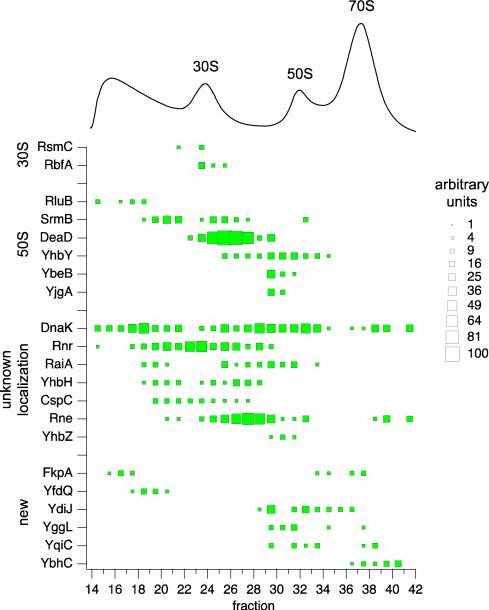
The ribosome is an essential and highly complex biological system in all living cells. A large body of literature on the assembly of the ribosome in vitro is available, but a clear picture of this process inside the cell has yet to emerge. Here, we directly characterized in vivo ribosome assembly intermediates and associated assembly factors from wild-type Escherichia coli cells using a general quantitative mass spectrometry (qMS) approach. The presence of distinct populations of ribosome assembly intermediates was verified using an in vivo stable isotope pulse-labeling approach, and their exact ribosomal protein contents were characterized against an isotopically labeled standard. The model-free clustering analysis of the resultant protein levels for the different ribosomal particles produced four 30S assembly groups that correlate very well with previous in vitro assembly studies of the small ribosomal subunit and six 50S assembly groups that clearly define an in vivo assembly landscape for the larger ribosomal subunit. In addition, de novo proteomics identified a total of 21 known and potentially new ribosome assembly factors co-localized with various ribosomal particles. These results represent new in vivo assembly maps of the E. coli 30S and 50S subunits, and the general qMS approach should prove to be a solid platform for future studies of ribosome biogenesis across a host of model organisms.


Figures

Fig. 1
Fig. 1
Overview of the qMS approach to the study of ribosomal particles. Experimental cultures were grown in chemically defined 15N M9 media (orange) and optionally pulsed with fresh 14N media for time t (green). Ribosomal particles were resolved over sucrose gradients, and individual fractions were spiked with isotopically labeled 70S ribosomes from cells grown entirely in 14N media (blue) before LC-MS analysis. The isotope distributions introduced in the experiment were quantitated using a Fourier Transform Convolution algorithm, and the protein level and fraction labeled values for each r-protein in the sucrose gradient fraction were calculated from the resultant amplitudes.
Fig. 2
Fig. 2
Survey of ribosomal particle levels across the wild-type sucrose gradient. (a) Virtual UV readings (see Experimental Procedures) for 30S (red line) and 50S (blue line) ribosomal particles were plotted alongside the observed OD reading of the wild-type sucrose gradient (dotted line). (b, c) Protein ratios for 30S and 50S subunits, respectively, normalized to the median in each fraction, are shown as box and whisker plots. The boxes in the plot indicate the second and third quartiles, and the whiskers indicate the 10th and 90th percentiles. Outliers are indicated as open circles. The red and blue dashed boxes indicate the fractions selected for clustering analysis.
Fig. 3
Fig. 3
Adjusted short-time pulse-labeling kinetics of wild-type ribosomal particles. (a) 0.5, 1, 2, and 5 minutes normalized pulse-labeling kinetics (see Experimental Procedures) for representative fractions (marked by arrows) of the early pre-30S, late pre-30S, and 30S regions of wild-type ribosomal particles resolved over a sucrose gradient. The boxes in the plot indicate the second and third quartiles, and the whiskers indicate the 10th and 90th percentiles. Outliers are indicated as open circles. (b) 50S short time pulse-labeling. See also Supplemental Fig. 3 for the normalized pulse-labeling kinetics of individual r-proteins from each in vivo assembly groups.
Fig. 4
Fig. 4
Clustering of wild-type assembly intermediate protein levels to form in vivo 30S and 50S assembly maps. (a) NPL values (see Experimental Procedures) for the 30S r-proteins across relevant regions of the sucrose gradient were clustered to yield their linkage trees (left). Groups of r-proteins with distinct protein level trends (more abundant to less abundant) across increasingly dense fractions of the sucrose gradient are marked as blue, green, orange, and red. (b) 50S assembly groups across increasingly dense fractions of the sucrose gradient are marked as blue, light blue, green yellow, orange, and red. Based on these assembly groups and previously established in vitro binding dependencies, new modified in vivo assembly maps for the 30S and 50S subunits are presented.
Fig. 5
Fig. 5
Pseudo 2D gel of wild-type ribosome assembly factors. Known and potentially new assembly factors are plotted against the sucrose gradient profile of wild-type ribosomal particles. The relative abundance of each assembly factor in a fraction, as measured by normalized spectral counts (see Experimental Procedures), is indicated by the size of the box.

References

    1. Kaczanowska M, Ryden-Aulin M. Ribosome biogenesis and the translation process in Escherichia coli. Microbiol Mol Biol Rev. 2007;71:477–94. - PMC - PubMed
    1. Paul BJ, Ross W, Gaal T, Gourse RL. rRNA transcription in Escherichia coli. Annu Rev Genet. 2004;38:749–70. - PubMed
    1. King TC, Sirdeskmukh R, Schlessinger D. Nucleolytic processing of ribonucleic acid transcripts in procaryotes. Microbiol Rev. 1986;50:428–51. - PMC - PubMed
    1. Shajani Z, Sykes MT, Williamson JR. Assembly of bacterial ribosomes. Annu Rev Biochem. 2011;80:501–26. - PubMed
    1. Sykes MT, Sperling E, Chen SS, Williamson JR. Quantitation of the ribosomal protein autoregulatory network using mass spectrometry. Anal Chem. 2010;82:5038–45. - PMC - PubMed

Publication types

MeSH terms

LinkOut - more resources