. 2013 Feb 8;425(3):647-61.
doi: 10.1016/j.jmb.2012.11.041. Epub 2012 Dec 7.

Impact of mutations on the allosteric conformational equilibrium

Affiliations

Impact of mutations on the allosteric conformational equilibrium

Patrick Weinkam et al. J Mol Biol. .

Abstract

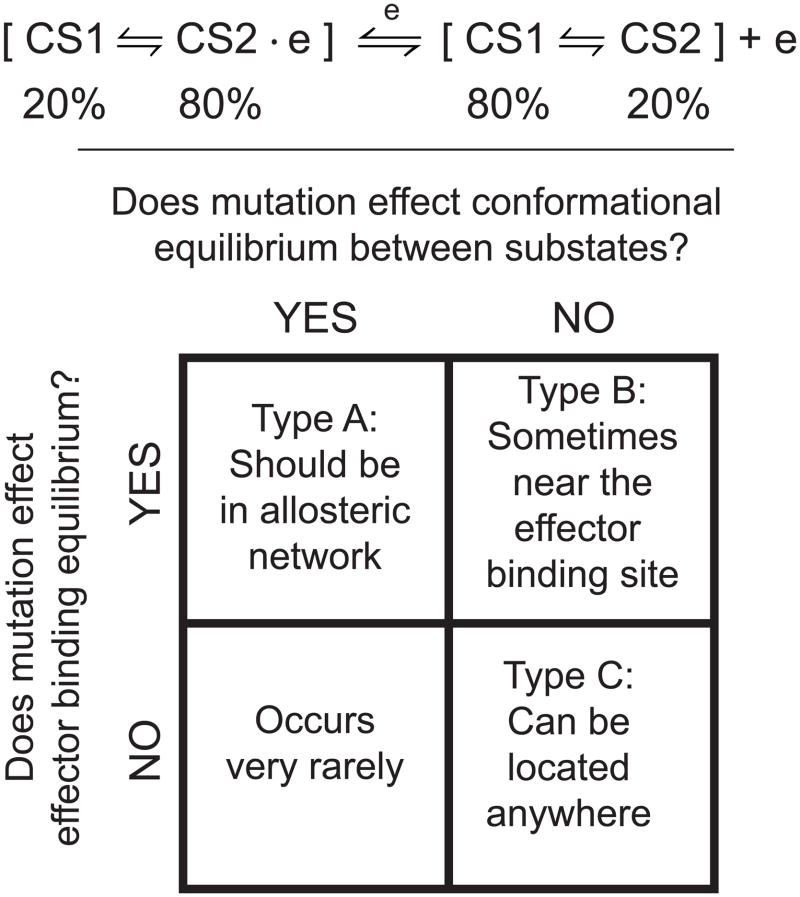
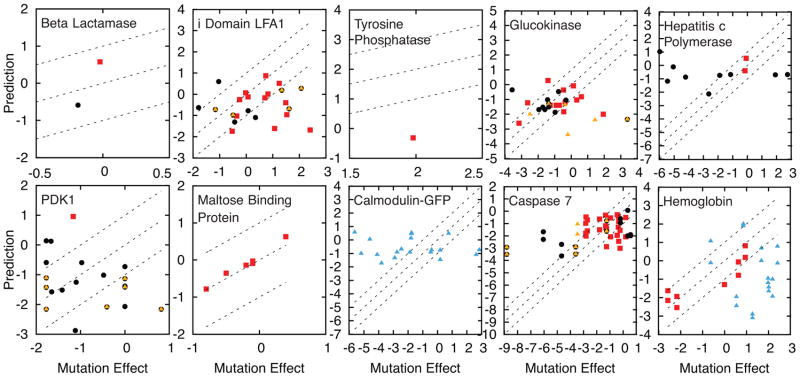
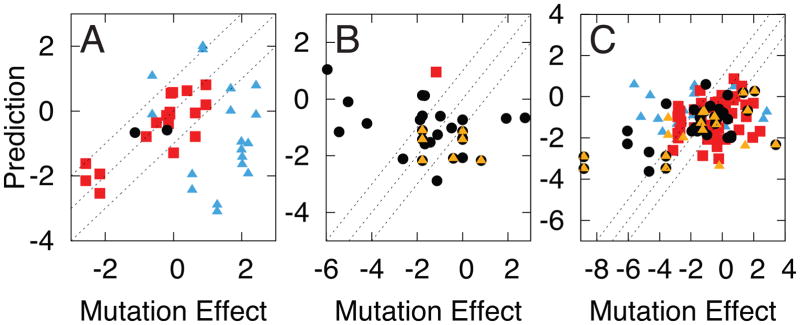
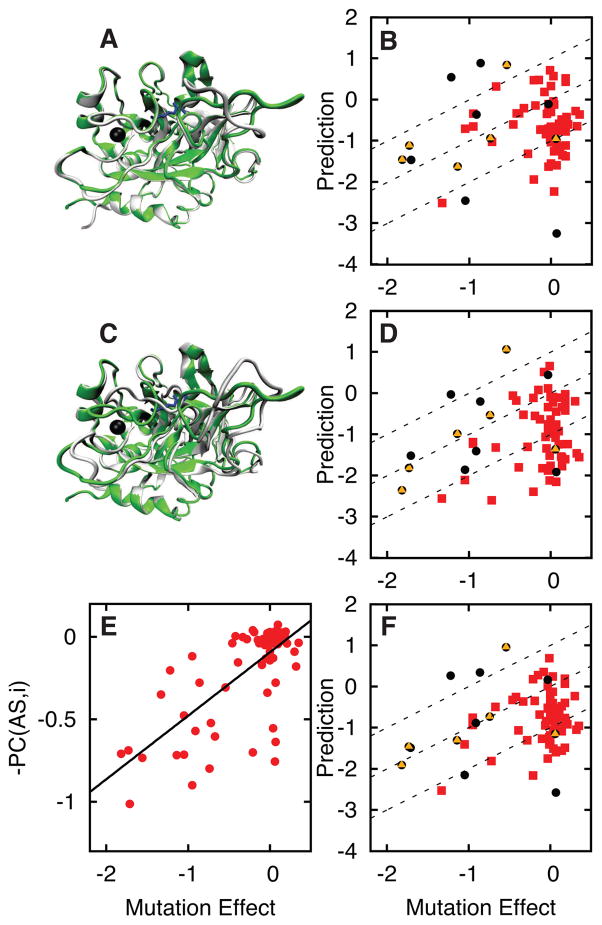
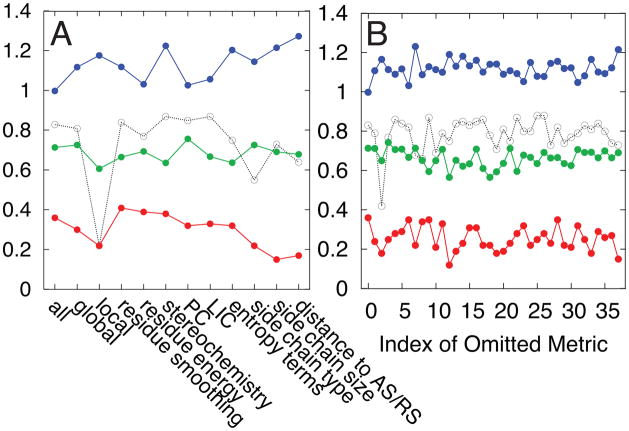
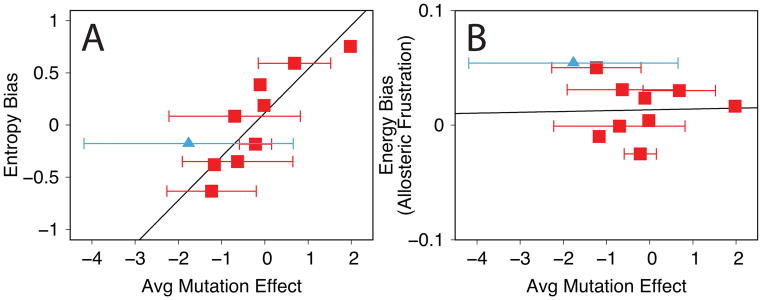
Allostery in a protein involves effector binding at an allosteric site that changes the structure and/or dynamics at a distant, functional site. In addition to the chemical equilibrium of ligand binding, allostery involves a conformational equilibrium between one protein substate that binds the effector and a second substate that less strongly binds the effector. We run molecular dynamics simulations using simple, smooth energy landscapes to sample specific ligand-induced conformational transitions, as defined by the effector-bound and effector-unbound protein structures. These simulations can be performed using our web server (http://salilab.org/allosmod/). We then develop a set of features to analyze the simulations and capture the relevant thermodynamic properties of the allosteric conformational equilibrium. These features are based on molecular mechanics energy functions, stereochemical effects, and structural/dynamic coupling between sites. Using a machine-learning algorithm on a data set of 10 proteins and 179 mutations, we predict both the magnitude and the sign of the allosteric conformational equilibrium shift by the mutation; the impact of a large identifiable fraction of the mutations can be predicted with an average unsigned error of 1k(B)T. With similar accuracy, we predict the mutation effects for an 11th protein that was omitted from the initial training and testing of the machine-learning algorithm. We also assess which calculated thermodynamic properties contribute most to the accuracy of the prediction.


Figures

Figure 1
Figure 1
The chemical equilibrium between effector-bound and unbound states ( P·eeP+e) should, for an allosteric protein, be expanded to include the conformational equilibrium between substates. One conformational substate binds the effector (CS2) and another substate less strongly binds the effector (CS1). In most cases, our allostery model allows a conformational substate to contain a diverse set of structures of similar energy, i.e. a substate may contain structurally diverse microstates. In some cases, CS1 and CS2 may be structurally similar, for instance, if a protein has an entropically driven allosteric mechanism. (bottom) There are three types of mutations that differ in how they modify the effector binding equilibrium and the conformational equilibrium. In reality, mutations can bridge the different categories.
Figure 2
Figure 2
Crystal structures of the effector-bound (green) and effector-unbound (white) structures are shown for A) β-lactamase, B) the i domain of lymphocyte function associated antigen, C) glucokinase, and D) hemoglobin. Effectors are shown in black and regulated site ligands are shown in blue, if applicable. For the i domain, poorly predicted residues (error > 2 kBT) are shown in red and the remaining predicted residues are shown in yellow. For hemoglobin, oxygen is shown in blue and diphosphoglycerate is shown in black in a large, hydrated pocket.
Figure 3
Figure 3
Mutation effects determined by experiment are predicted using machine learning in units of kBT. Each panel is a different protein. Red squares indicate mutation effects in the AC set. The remaining mutations are either: 1) involving a charged residue and an increase of 4 or more side chain atoms (yellow triangles) and/or 2) less than 8 Å from the effector (black circles). Blue triangles indicate mutations that affect more than one relevant conformational equilibria. Dashed lines represent a 1 kBT range of accuracy.
Figure 4
Figure 4
Mutation effects determined by experiment are predicted using machine learning in units of kBT. Each panel is a different data type: A) type 1, B) type 2, and C) type 3. Red squares indicate mutation effects in the AC set. The remaining mutations are either: 1) involving a charged residue and an increase of 4 or more side chain atoms (yellow triangles) and/or 2) less than 8 Å from the effector (black circles). Blue triangles indicate mutations that affect more than one relevant conformational equilibria. Dashed lines represent a 1 kBT range of accuracy. The correlation for type 1 is 0.83. The correlation for type 3 is 0.25 and becomes 0.42 if all mutations with charged residues are omitted.
Figure 5
Figure 5
Sodium binding to thrombin is modeled using two different sodium unbound (low activity) crystal structures. The sodium bound crystal structure 1SG8 (green) is shown with A) unbound crystal structure 1SGI (white) and C) unbound crystal structure 2GP9 (white). Sodium is shown as a black sphere and an active site inhibitor is shown with blue sticks. B,D) Mutation effect predictions are shown based on energy landscapes defined using A and C, respectively. E) The negative of the Pseudo Correlation feature shows how each mutation site is correlated with the allosteric site, i.e. −1 times feature 3 in Table 2 (average pseudo correlation from the two simulations). The best fit line is shown in black (R = 0.71). F) The average of the mutation effect predictions in B and D. As in Figures 3–4, red squares indicate mutation effects corresponding to the AC set. The remaining mutations are either: 1) involving a charged residue and an increase of 4 or more side chain atoms (yellow triangles) and/or 2) less than 8 Å from the effector (black circles). Dashed lines represent a 1 kBT range of accuracy.
Figure 6
Figure 6
The importance of a feature is tested by excluding one or more features during the prediction: A) groups of features are excluded B) individual features are excluded. The features are listed in Table 2. The left most data points in each panel represent the prediction using all features. Blue lines are the averaged unsigned error (kBT) of all mutations in the AC set (red squares in Figures 3–4). Green lines are the fraction of mutation effects in the AC set correctly predicted to be positive or negative. Red and dashed lines are the correlation coefficients for the AC set and for type 1 data, respectively.
Figure 7
Figure 7
Plots showing the relationship between the average mutation effect for each protein and global features: A) the entropy bias and B) the energy bias (features 29 and 32 in Table 2). Error bars represent the standard deviation of the mutation effects in each protein. The calmodulin-GFP calcium sensor protein is shown with blue triangles. Black lines are the linear fit. The correlation coefficients are 0.88 for the entropy bias and 0.03 for the energy bias.

References

    1. Weinkam P, Pons J, Sali A. Structure-based model of allostery predicts coupling between distant sites. Proc Natl Acad Sci U S A. 2012;109:4875–80. - PMC - PubMed
    1. Monod J, Wyman J, Changeux JP. On nature of allosteric transitions - a plausible model. Journal of Molecular Biology. 1965;12:88. - PubMed
    1. Koshland DE, Nemethy G, Filmer D. Comparison of experimental binding data and theoretical models in proteins containing subunits. Biochemistry. 1966;5:365–368. - PubMed
    1. Kuriyan J, Eisenberg D. The origin of protein interactions and allostery in colocalization. Nature. 2007;450:983–990. - PubMed
    1. Boehr DD, Nussinov R, Wright PE. The role of dynamic conformational ensembles in biomolecular recognition. Nature Chemical Biology. 2009;5:789–796. - PMC - PubMed

Publication types