

Geographically selective assortment of cycles in pandemics: meta-analysis of data collected by Chizhevsky
- PMID: 23228468
- PMCID: PMC3815457
- DOI: 10.1017/S0950268812002804
Geographically selective assortment of cycles in pandemics: meta-analysis of data collected by Chizhevsky
Abstract
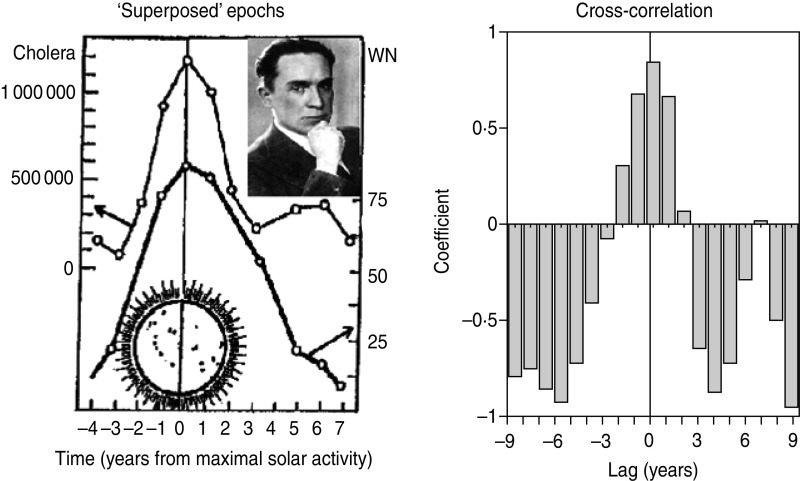
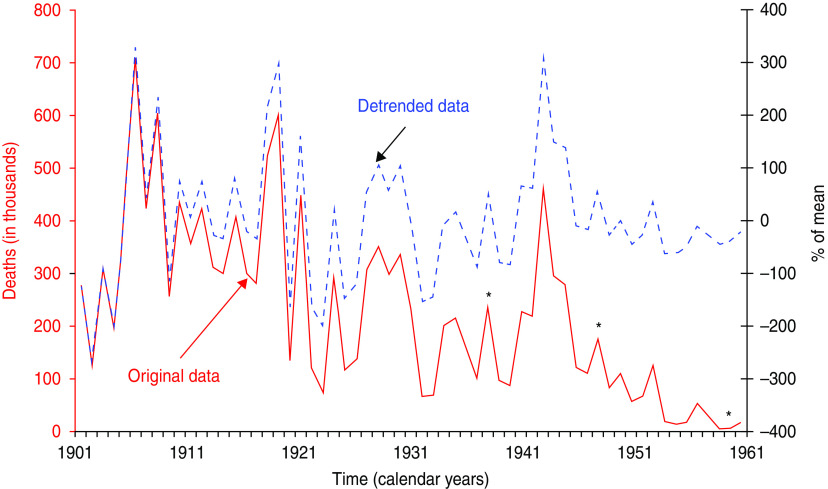
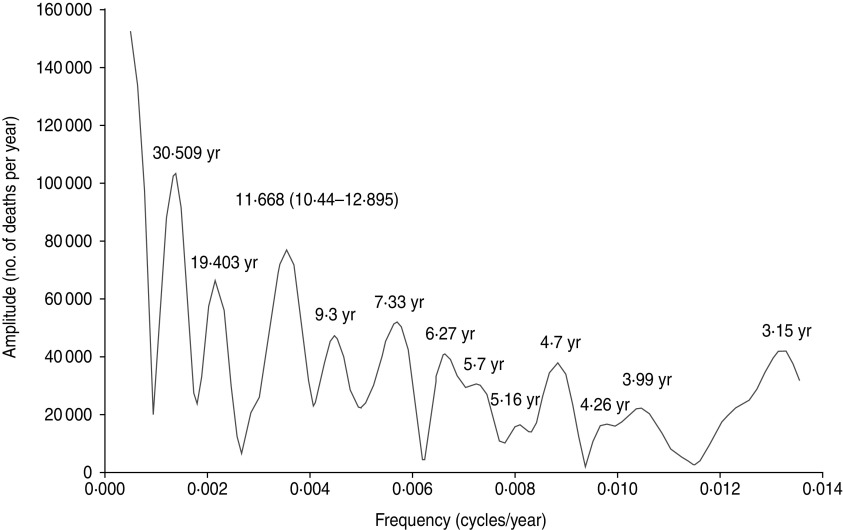
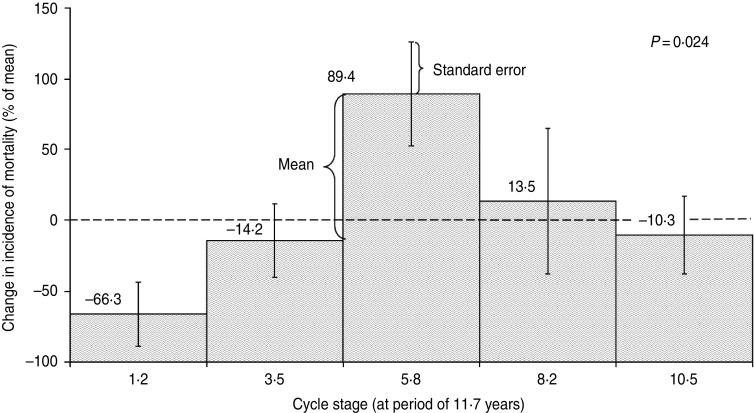
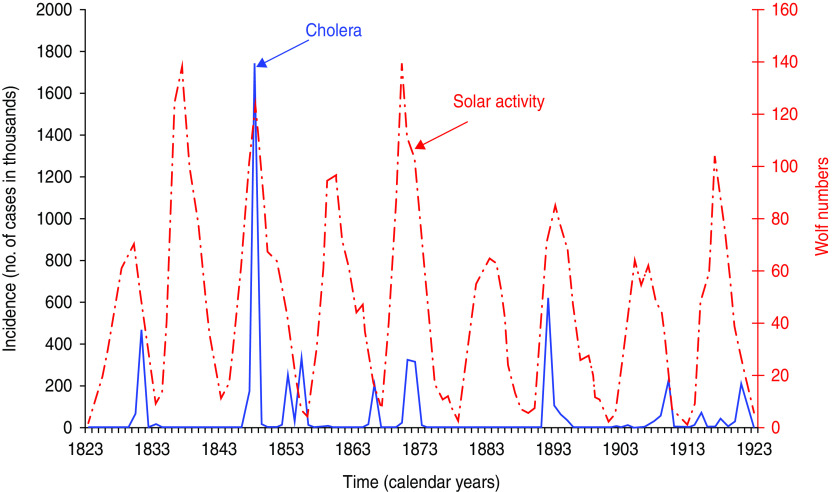
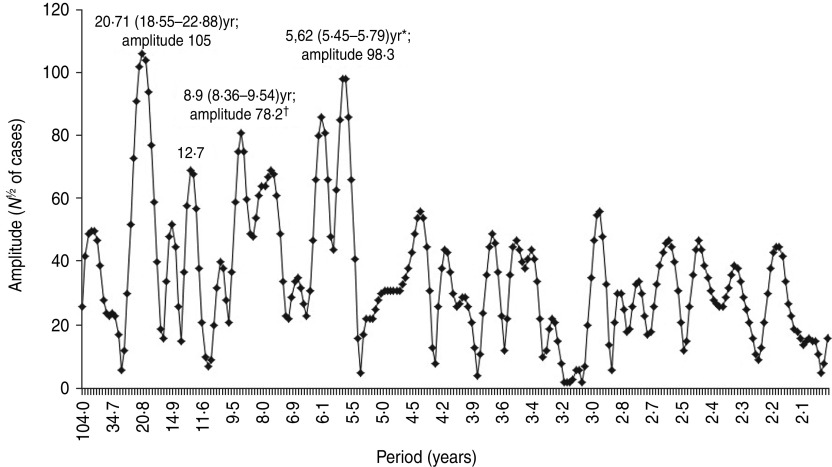
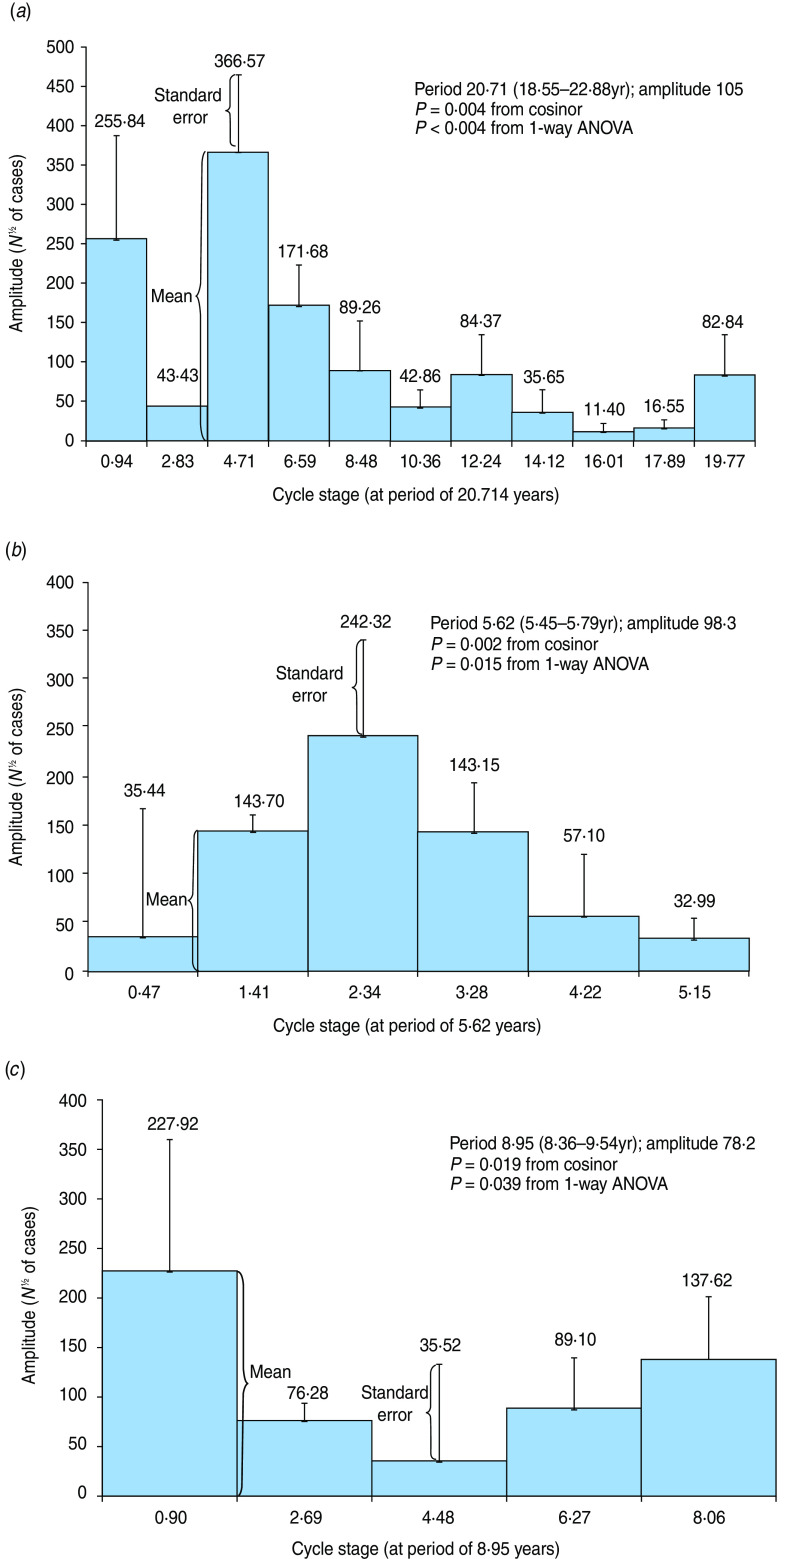
In the incidence patterns of cholera, diphtheria and croup during the past when they were of epidemic proportions, we document a set of cycles (periods), one of which was reported and discussed by A. L. Chizhevsky in the same data with emphasis on the mirroring in human disease of the ~11-year sunspot cycle. The data in this study are based on Chizhevsky’s book The Terrestrial Echo of Solar Storms and on records from the World Health Organization. For meta-analysis, we used the extended linear and nonlinear cosinor. We found a geographically selective assortment of various cycles characterizing the epidemiology of infections, which is the documented novel topic of this paper, complementing the earlier finding in the 21st century or shortly before, of a geographically selective assortment of cycles characterizing human sudden cardiac death. Solar effects, if any, interact with geophysical processes in contributing to this assortment.
Figures
Similar articles
-
[Effects of solar activity on some demographic indices and morbidity in Azerbaijan with reference to A. L. Chizhevsky's theory].Vopr Kurortol Fizioter Lech Fiz Kult. 2007 May-Jun;(3):38-42. Vopr Kurortol Fizioter Lech Fiz Kult. 2007. PMID: 17645080 Russian.
-
A hypothesis: Sunspot cycles may detect pandemic influenza A in 1700-2000 A.D.Med Hypotheses. 2006;67(5):1016-22. doi: 10.1016/j.mehy.2006.03.048. Epub 2006 Jun 27. Med Hypotheses. 2006. PMID: 16806734
-
Chronoastrobiology: proposal, nine conferences, heliogeomagnetics, transyears, near-weeks, near-decades, phylogenetic and ontogenetic memories.Biomed Pharmacother. 2004 Oct;58 Suppl 1:S150-87. doi: 10.1016/s0753-3322(04)80025-8. Biomed Pharmacother. 2004. PMID: 15754855
-
[Epidemiological Surveillance of Cholera in Russia During the Period of the Seventh Pandemic].Vestn Ross Akad Med Nauk. 2015;(2):249-56. doi: 10.15690/vramn.v70i2.1320. Vestn Ross Akad Med Nauk. 2015. PMID: 26234099 Review. Russian.
-
Sunspot activity and influenza pandemics: a statistical assessment of the purported association.Epidemiol Infect. 2017 Oct;145(13):2640-2655. doi: 10.1017/S095026881700173X. Epub 2017 Aug 29. Epidemiol Infect. 2017. PMID: 28847318 Free PMC article. Review.
Cited by
-
27-day cycles in human mortality: Traute and Bernhard Düll.Hist Geo Space Sci. 2013;4:10.5194/hgss-4-47-2013. doi: 10.5194/hgss-4-47-2013. Hist Geo Space Sci. 2013. PMID: 24224144 Free PMC article.
-
Superposed epoch analysis of physiological fluctuations: possible space weather connections.Int J Biometeorol. 2018 Mar;62(3):449-457. doi: 10.1007/s00484-017-1453-7. Epub 2017 Oct 13. Int J Biometeorol. 2018. PMID: 29030696 Free PMC article.
-
Potential influence of geomagnetic activity on blood pressure statistical fluctuations at mid-magnetic latitudes.Commun Med (Lond). 2025 Apr 28;5(1):143. doi: 10.1038/s43856-025-00822-w. Commun Med (Lond). 2025. PMID: 40295716 Free PMC article.
-
Cyclic variations in the dynamics of flu incidence in Azerbaijan, 1976-2000.Epidemiol Infect. 2015 Jan;143(1):13-22. doi: 10.1017/S095026881400048X. Epub 2014 Mar 18. Epidemiol Infect. 2015. PMID: 24641968 Free PMC article.
References
-
- Chizhevsky AL. Les épidémies et les perturbations électromagnétiques du milieu extérieur. Paris: Éditions Hippocrate, 1938, 239 pp.
-
- Chizhevsky AL. Physical Factors of Historical Processes. Kaluga, Russia, 1924, pp. 72.
-
- Chizhevsky AL. The Terrestrial Echo of Solar Storms, 2nd edn. Moscow: Mysl, 1976, pp. 367.
-
- Jain M, et al. Multidrug resistant Vibrio cholerae O1 El Tor carrying classical ctxB allele involved in a cholera outbreak in South Western India. Acta Tropica 2011; 117: 152–156. - PubMed
-
- Pollitzer R. Cholera. Monograph series (World Health Organization), no. 43. Geneva: World Health Organization, 1959, v. 43, 1019 pp. - PubMed
Publication types
MeSH terms
Grants and funding
LinkOut - more resources
Full Text Sources
Medical
Miscellaneous
