. 2013 Jun;7(3):379-91.
doi: 10.1016/j.molonc.2012.11.002. Epub 2012 Nov 23.

Leptin increases HER2 protein levels through a STAT3-mediated up-regulation of Hsp90 in breast cancer cells

Affiliations

Leptin increases HER2 protein levels through a STAT3-mediated up-regulation of Hsp90 in breast cancer cells

Cinzia Giordano et al. Mol Oncol. 2013 Jun.

Abstract

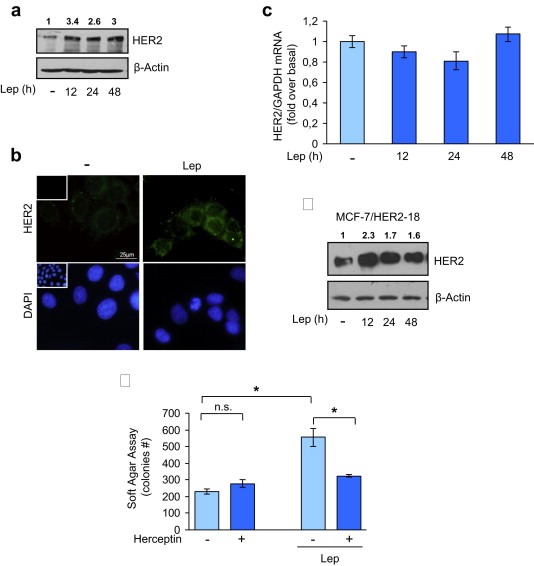
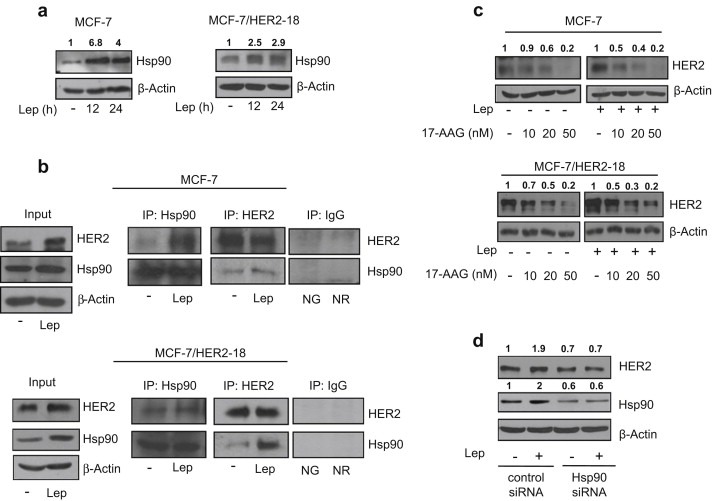
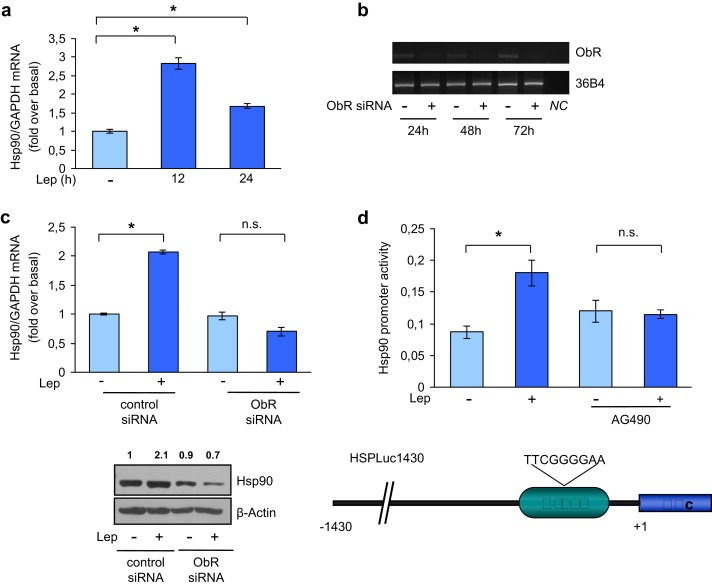
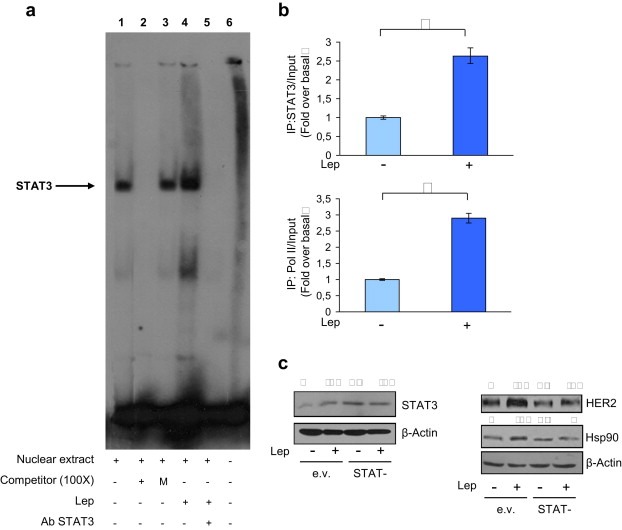
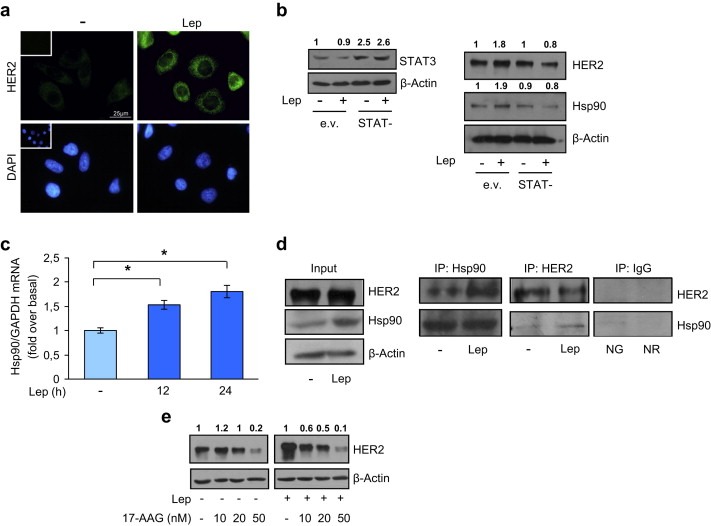
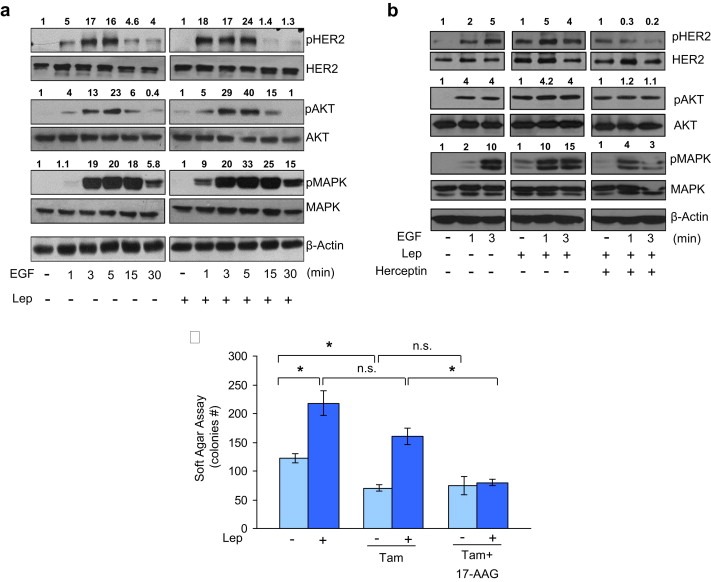
Obesity condition confers risks to breast cancer development and progression, and several reports indicate that the adipokine leptin, whose synthesis and plasma levels increase with obesity, might play an important role in modulating breast cancer cell phenotype. Functional crosstalk occurring between leptin and different signaling molecules contribute to breast carcinogenesis. In this study, we show, in different human breast cancer cell lines, that leptin enhanced the expression of a chaperone protein Hsp90 resulting in increased HER2 protein levels. Silencing of Hsp90 gene expression by RNA interference abrogated leptin-mediated HER2 up-regulation. Leptin effects were dependent on JAK2/STAT3 activation, since inhibition of this signaling cascade by AG490 or ectopic expression of a STAT3 dominant negative abrogated leptin-induced HER2 and Hsp90 expressions. Functional experiments showed that leptin treatment significantly up-regulated human Hsp90 promoter activity. This occurred through an enhanced STAT3 transcription factor binding to its specific responsive element located in the Hsp90 promoter region as revealed by electrophoretic mobility shift assay and chromatin immunoprecipitation assay. Analysis of HER2, Akt and MAPK phosphorylation levels revealed that leptin treatment amplified the responsiveness of breast cancer cells to growth factor stimulation. Furthermore, we found that long-term leptin exposure reduced sensitivity of breast cancer cells to the antiestrogen tamoxifen. In the same experimental conditions, the combined treatment of tamoxifen with the Hsp90 inhibitor 17-AAG completely abrogated leptin-induced anchorage-independent breast cancer cell growth. In conclusion, our results highlight, for the first time, the ability of the adipocyte-secreted factor leptin to modulate Hsp90/HER2 expressions in breast cancer cells providing novel insights into the molecular mechanism linking obesity to breast cancer growth and progression.


Figures

Figure 1
Figure 1
Leptin effects on HER2 expression. (a) MCF‐7 cells were untreated (−) or treated for 12, 24 and 48 h with leptin 500 ng/ml (Lep) before lysis. Equal amounts of total cellular extracts were analyzed for HER2 protein levels by immunoblotting analysis. β‐Actin was used as loading control. (b) Immunofluorescence of HER2 in MCF‐7 cells untreated (−) or treated with Lep for 24 h. Small squares, negative controls. 4′,6‐Diamidino‐2‐phenylindole (DAPI) staining was used to visualize the cell nucleus. Scale bar = 25 μm. (c) mRNA HER2 content, evaluated by real‐time RT‐PCR, after treatment with Lep as indicated. Each sample was normalized to its GAPDH mRNA content. The values represent the means ± s.d. of three different experiments each performed in triplicate. (d) Immunoblotting analysis of HER2 in total protein extracts from MCF‐7/HER2‐18 cells treated with Lep as indicated; β‐actin was used as loading control. (e) Soft‐agar growth assay in MCF‐7 cells treated with Lep in the presence or absence of herceptin (10 μg/ml). After 14 days of growth, colonies >50 μm diameter were counted. n.s., nonsignificant; *p < 0.05. Numbers on top of the blots represent the average fold change versus untreated cells normalized for β‐actin.
Figure 2
Figure 2
Leptin enhances Hsp90 expression. (a) Immunoblotting analysis of Hsp90 levels in total protein extracts from MCF‐7 (left panel) and MCF‐7/HER2‐18 (right panel) cells untreated (−) or treated with leptin 500 ng/ml (Lep) as indicated. (b) MCF‐7 (upper panel) and MCF‐7/HER2‐18 (lower panel) cells were untreated (−) or treated with Lep for 24 h before lysis. Hsp90 and HER2 proteins were immunoprecipitated using anti‐Hsp90 (IP:Hsp90) and anti‐HER2 (IP:HER2) antibodies respectively and resolved in SDS–polyacrylamide gel electrophoresis. Immunoblotting was performed using anti‐HER2 and anti‐Hsp90 antibodies respectively. Whole‐cell lysates (Input) were used as input controls. Negative control was performed by incubation of cell lysates with protein A/G agarose and normal goat (NG) or rabbit (NR) antisera. (c) Immunoblotting analysis of HER2 from total extracts of MCF‐7 (upper panel) and MCF‐7/HER2‐18 (lower panel) cells treated for 24 h with Lep (500 ng/ml) in the presence or not of growing doses (10–20 and 50 nM) of the selective Hsp90 inhibitor 17‐allylamino‐17‐demethoxygeldanamycin (17‐AAG). (d) Total cellular proteins were isolated from MCF‐7 cells transfected with Hsp90 siRNA or control siRNA and treated for 24 h with Lep. Equal amounts of total cellular extracts were analyzed for HER2 and Hsp90 protein levels by immunoblotting. β‐Actin was used as loading control. Numbers on top of the blots represent the average fold change versus untreated cells normalized for β‐actin.
Figure 3
Figure 3
Leptin induces Hsp90 promoter activity. (a) mRNA Hsp90 content, evaluated by real‐time RT‐PCR, after 12 and 24 h with leptin 500 ng/ml (Lep). Each sample was normalized to its GAPDH mRNA content. The values represent the means ± s.d. of three different experiments each performed in triplicate. *p < 0.05. (b) ObR mRNA expression in MCF‐7 cells transfected with siRNA targeted human ObR mRNA sequence or with a control siRNA (−) for 24, 48, and 72 h 36B4 was used as loading control. NC, negative control, RNA sample without the addition of reverse transcriptase. (c) Hsp90 mRNA levels (upper panel) and protein levels (lower panel) in MCF‐7 cells transfected with ObR siRNA or control siRNA for 24 h followed by Lep treatment for 24 h. Each sample was normalized to its GAPDH mRNA content. The values represent the means ± SD of three different experiments each performed in triplicate. n.s., nonsignificant; *p < 0.05 compared to untreated cells (−). β‐Actin was used as loading control. Numbers on top of the blots represent the average fold change versus untreated cells normalized for β‐actin. (d) MCF‐7 cells transiently transfected with a HSPLuc1430 reporter gene were untreated (−) or treated with Lep for 12 h in the presence or not of AG490 (1 μM) and then luciferase activity was measured (upper panel). The values represent the means ± s.d. of three different experiments each performed in triplicate. n.s., nonsignificant; *p < 0.05. Schematic representation of Hsp90 promoter region used in this study (lower panel).
Figure 4
Figure 4
Leptin regulates Hsp90 promoter activity through STAT3‐binding site. (a) Nuclear extracts from MCF‐7 cells were incubated with a double‐stranded STAT3 specific sequence probe labeled with [γ32P]ATP and subjected to electrophoresis in a 6% polyacrylamide gel (lane 1). Competition experiments were performed adding as competitor a 100‐fold molar excess of unlabeled probe (lane 2) or a 100‐fold molar excess of unlabeled oligonucleotide containing a mutated STAT3 sequence (lane 3). Lane 4, nuclear extracts from MCF‐7 cells treated with leptin 500 ng/ml (Lep). Lanes 5, leptin‐treated nuclear extracts incubated with anti‐STAT3 antibody. Lane 6, probe alone. (b) MCF‐7 cells were treated or not (−) with Lep for 1 h, cross‐linked with formaldehyde and lysed. The precleared chromatin was immunoprecipitated with anti‐STAT3 (upper panel) and anti‐RNA‐polymerase II (lower panel) antibodies. A 5 μl volume of each sample and input was analyzed by real‐time PCR using specific primers to amplify Hsp90 promoter sequence, including the STAT3 site. Similar results were obtained in multiple independent experiments. (c) MCF‐7 cells were transiently transfected with either empty vector (e.v.) or STAT3 dominant negative plasmid (STAT−) and then treated or not (−) with Lep for 24 h. STAT3, HER2 land Hsp90 levels were evaluated by immunoblotting. β‐Actin was used as loading control. Numbers on top of the blots represent the average fold change versus untreated cells normalized for β‐actin.
Figure 5
Figure 5
Leptin‐induced expression of HER2 and Hsp90 in ERα‐negative SKBR3 breast cancer cells. (a) SKBR3 cells were untreated (−) or treated with leptin 500 ng/ml (Lep) for 24 h and then HER2 expression was determined by immunofluorescence analysis. Small squares, negative controls. DAPI staining was used to visualize the cell nucleus. Scale bar = 25 μm. (b) Cells were transiently transfected with either empty vector (e.v.) or STAT3 dominant negative plasmid (STAT−) and then untreated (−) or treated with Lep for 24 h. STAT3, HER2 land Hsp90 levels were evaluated by immunoblotting. β‐Actin was used as loading control. (c) Hsp90 mRNA content, evaluated by real‐time RT‐PCR, after treatment with Lep as indicated. Each sample was normalized to its GAPDH mRNA content. The values represent the means ± s.d. of three different experiments each performed in triplicate. *p < 0.05. (d) SKBR3 cells were treated with vehicle (−) or Lep for 12 h before lysis. Hsp90 and HER2 proteins were immunoprecipitated using anti‐Hsp90 (IP:Hsp90) and anti‐HER2 (IP:HER2) antibodies respectively, the immunocomplexes were resolved in SDS–polyacrylamide gel electrophoresis. Immunoblotting was performed using anti‐HER2 and anti‐Hsp90 antibodies respectively. Whole‐cell lysates (Input) were used as input controls. Negative control was performed by incubation of cell lysates with protein A/G agarose and normal goat (NG) or rabbit (NR) antisera. (e) Immunoblotting analysis of HER2 from total extracts of SKBR3 cells treated for 12 h with Lep in the presence or not of growing doses (10–20 and 50 nM) of the selective Hsp90 inhibitor 17‐AAG. β‐Actin was used as loading control. Numbers on top of the blots represent the average fold change versus untreated cells normalized for β‐actin.
Figure 6
Figure 6
Effects of leptin on growth factor signaling and responsiveness to the antiestrogen tamoxifen. (a) MCF‐7 cells were treated with leptin 500 ng/ml (Lep) for 24 h and then treated with EGF 100 ng/ml as indicated. Levels of phosphorylated (p) HER2 (Tyr1248), Akt (Ser473), and MAPK (Thr202/Tyr204), at the indicated residues, and total non‐phosphorylated protein were measured in cellular extracts by immunoblot analysis. (b) MCF‐7 cells were treated with Lep for 24 h and then treated with EGF and herceptin (10 μg/ml) alone or in combination as indicated. Levels of phosphorylated (p) HER2 (Tyr1248), Akt (Ser473), and MAPK (Thr202/Tyr204), at the indicated residues, and total non‐phosphorylated protein were measured in cellular extracts by immunoblot analysis. β‐Actin was used as loading control. Numbers on top of the blots represent the average fold change versus untreated cells normalized for β‐actin. (c) Soft‐agar growth assay in MCF‐7 cells treated with Lep, tamoxifen (Tam, 1 μM) and 17‐AAG (20 nM) alone or in combination. After 14 days of growth, colonies >50 μm diameter were counted. n.s., nonsignificant; *p < 0.05.

Similar articles

Cited by

References

    1. Ahima, R.S. , Osei, S.Y. , 2004. Leptin signaling. Physiol. Behav. 81, (2) 223–241. - PubMed
    1. Akerfelt, M. , Morimoto, R.I. , Sistonen, L. , 2010. Heat shock factors: integrators of cell stress, development and lifespan. Nat. Rev. Mol. Cell Biol. 11, (8) 545–555. - PMC - PubMed
    1. Allred, D.C. , Clark, G.M. , Molina, R. , Tandon, A.K. , Schnitt, S.J. , Gilchrist, K.W. , Osborne, C.K. , Tormey, D.C. , McGuire, W.L. , 1992. Overexpression of HER-2/neu and its relationship with other prognostic factors change during the progression of in situ to invasive breast cancer. Hum. Pathol. 23, (9) 974–979. - PubMed
    1. Andò, S. , Catalano, S. , 2011. The multifactorial role of leptin in driving the breast cancer microenvironment. Nat. Rev. Endocrinol. 8, (5) 263–275. - PubMed
    1. Arpino, G. , Green, S.J. , Allred, D.C. , Lew, D. , Martino, S. , Osborne, C.K. , Elledge, R.M. , 2004. HER-2 amplification, HER-1 expression, and tamoxifen response in estrogen receptor-positive metastatic breast cancer: a southwest oncology group study. Clin. Cancer Res. 10, (17) 5670–5676. - PubMed

Publication types

MeSH terms