

A carbon nanofiber based biosensor for simultaneous detection of dopamine and serotonin in the presence of ascorbic acid
- PMID: 23228495
- PMCID: PMC3746014
- DOI: 10.1016/j.bios.2012.10.080
A carbon nanofiber based biosensor for simultaneous detection of dopamine and serotonin in the presence of ascorbic acid
Abstract
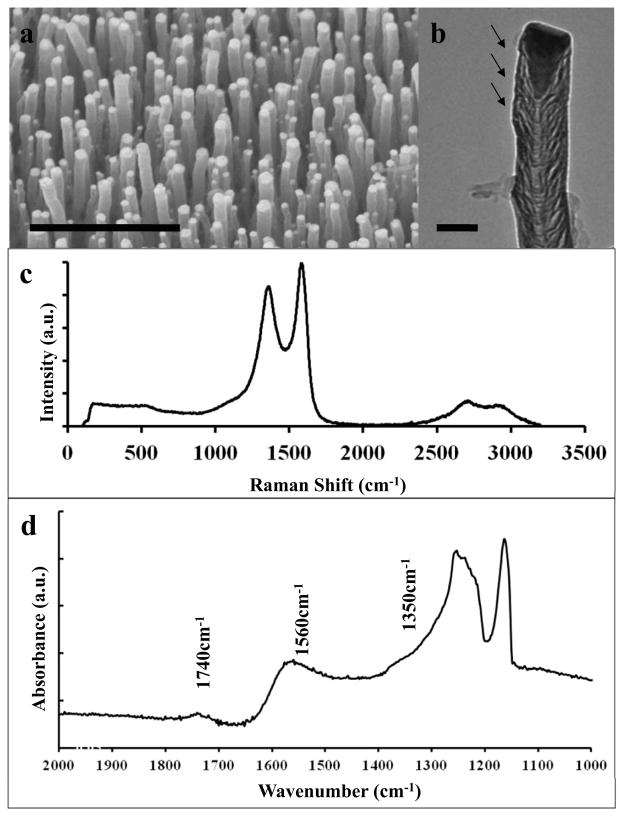
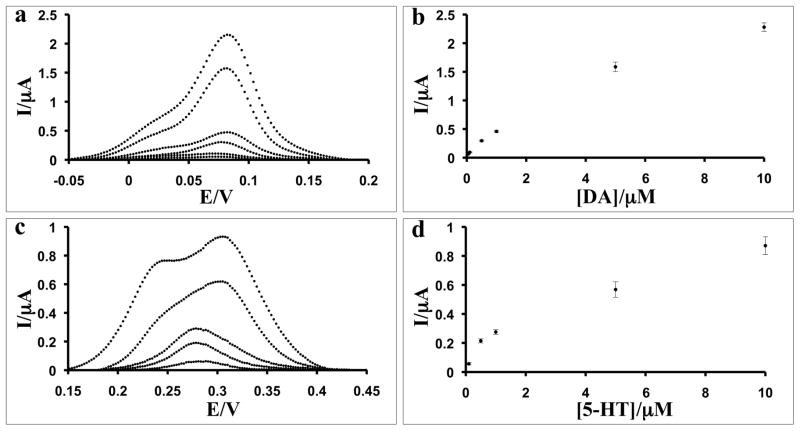
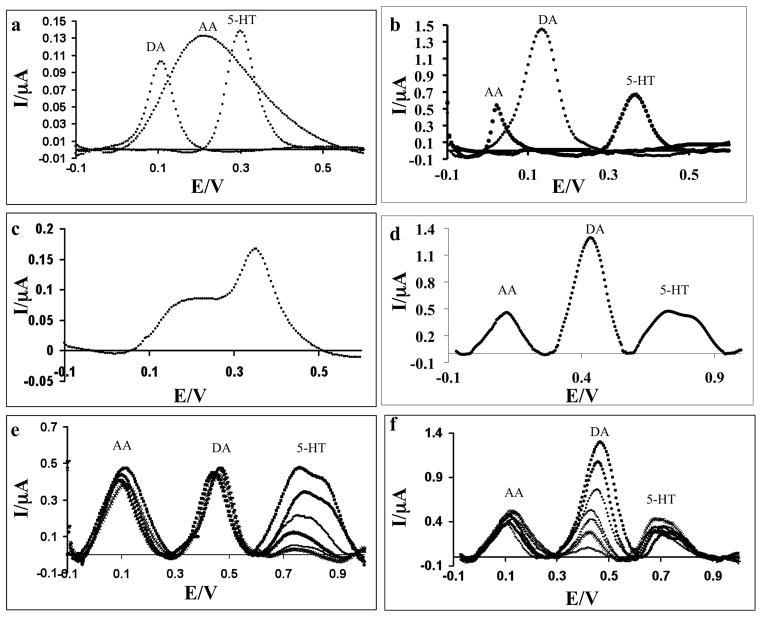
A biosensor based on an array of vertically aligned carbon nanofibers (CNFs) grown by plasma enhanced chemical vapor deposition is found to be effective for the simultaneous detection of dopamine (DA) and serotonin (5-HT) in the presence of excess ascorbic acid (AA). The CNF electrode outperforms the conventional glassy carbon electrode (GCE) for both selectivity and sensitivity. Using differential pulse voltammetry (DPV), three distinct peaks are seen for the CNF electrode at 0.13 V, 0.45 V, and 0.70 V for the ternary mixture of AA, DA, and 5-HT. In contrast, the analytes are indistinguishable in a mixture using a GCE. For the CNF electrode, the detection limits are 50 nM for DA and 250 nM for 5-HT.
Published by Elsevier B.V.
Figures
References
-
- Adams RN. Anal Chem. 1976;48:1128A–1138A. - PubMed
-
- Alwarappan S, Erdem A, Liu C, Li CZ. J Phys Chem C. 2009;113:8853–8857.
-
- Alwarappan S, Liu G, Li CZ. Nanomed Nanotech Bio Med. 2010;6:52–57. - PubMed
-
- Anastassiou CA, Patel BA, Arundell M, Yeoman MS, Parker KH, O’Hare D. Anal Chem. 2006;78:6990–6998. - PubMed
-
- Arumugam PU, Chen H, Siddiqui S, Weinrich JAP, Jejelowo A, Li J, Meyyappan M. Biosens Bioselectron. 2009;24:2818–2824. - PubMed
Publication types
MeSH terms
Substances
Grants and funding
LinkOut - more resources
Full Text Sources
Other Literature Sources
