

The relationship between tetanus intensity and the magnitude of hippocampal long-term potentiation in vivo
- PMID: 23228809
- PMCID: PMC3746156
- DOI: 10.1016/j.neuroscience.2012.11.056
The relationship between tetanus intensity and the magnitude of hippocampal long-term potentiation in vivo
Abstract
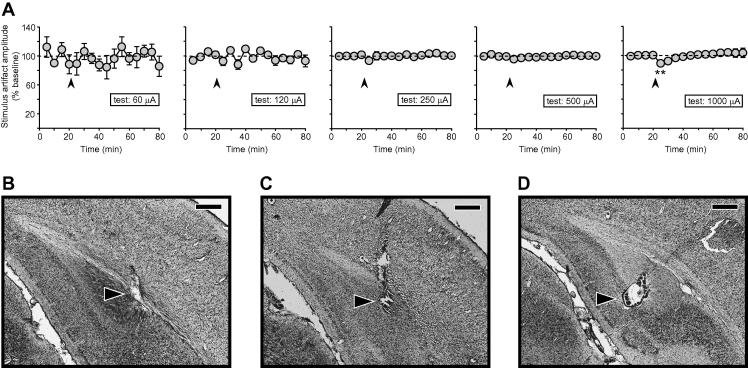
In this study, we assessed the effects of varying tetanus and test-pulse intensity on the magnitude of long-term potentiation (LTP) in the perforant path-dentate gyrus projection of urethane-anaesthetized rats. We developed a novel within-subjects procedure in which test-pulse-stimulation intensity (60-1000 μA) was varied quasi-randomly under computer control throughout the recording period. After a baseline period, we applied a high-frequency tetanus, the intensity of which was varied over the same range as test-pulse intensity, but between subjects. The time-course of LTP was thus monitored continuously across a range of test-pulse intensities in each rat. Intense high-frequency tetanization at 1000 μA resulted in a paradoxical depression of the dentate field excitatory post-synaptic potential (fEPSP) slope at the lowest test intensity used (60 μA), but caused a potentiation at higher test intensities in the same animal. Moreover, intense tetanization induced less LTP than a moderate tetanus over most of the test-intensity range. Explanations for this pattern of data include a potentiation of feed-forward inhibition in conjunction with LTP of excitatory neurotransmission, or local tissue damage at the stimulation site. To address this issue, we conducted an additional experiment in which a second stimulating electrode was placed in the perforant path at a site closer to the dentate, in order to activate a common population of afferents at a location 'downstream' of the original stimulation site. After 1000-μA tetanization of the original ('upstream') site, fEPSPs were again depressed in response to test stimulation of the upstream site, but only potentiation was observed in response to stimulation of the downstream site. This is consistent with the idea that the depression induced by intense tetanization results from local changes at the stimulation site. In conclusion, while tetanus intensity must exceed the LTP induction threshold, intensities above 500 μA should be avoided; in the present study, tetanization at 250-500 μA yielded maximal levels of LTP.
Copyright © 2013 IBRO. Published by Elsevier Ltd. All rights reserved.
Figures


Similar articles
-
Modulation of extracellular monoamine transmitter concentrations in the hippocampus after weak and strong tetanization of the perforant path in freely moving rats.Brain Res. 2009 Jun 1;1273:29-38. doi: 10.1016/j.brainres.2009.03.055. Epub 2009 Apr 2. Brain Res. 2009. PMID: 19345680
-
Heterosynaptic LTD and depotentiation in the medial perforant path of the dentate gyrus in the freely moving rat.J Neurophysiol. 1997 Feb;77(2):571-8. doi: 10.1152/jn.1997.77.2.571. J Neurophysiol. 1997. PMID: 9065830
-
Effects of reversible inactivation of locus coeruleus on long-term potentiation in perforant path-DG synapses in rats.Neurobiol Learn Mem. 2008 Sep;90(2):309-16. doi: 10.1016/j.nlm.2008.05.012. Epub 2008 Jul 10. Neurobiol Learn Mem. 2008. PMID: 18577458
-
The CB1 receptor antagonist, SR141716A, prevents high-frequency stimulation-induced reduction of feedback inhibition in the rat dentate gyrus following perforant path stimulation in vivo.Brain Res. 2008 Aug 5;1223:50-8. doi: 10.1016/j.brainres.2008.05.065. Epub 2008 Jun 5. Brain Res. 2008. PMID: 18599027
-
The effect of interburst intervals on measures of hippocampal LTP in the freely moving adult male rat.Exp Neurol. 2001 Aug;170(2):371-4. doi: 10.1006/exnr.2001.7713. Exp Neurol. 2001. PMID: 11476603
Cited by
-
Hippocampal Lateralization and Synaptic Plasticity in the Intact Rat: No Left-Right Asymmetry in Electrically Induced CA3-CA1 Long-Term Potentiation.Neuroscience. 2019 Jan 15;397:147-158. doi: 10.1016/j.neuroscience.2018.11.044. Epub 2018 Dec 2. Neuroscience. 2019. PMID: 30513373 Free PMC article.
-
Hippocampal Cholinergic Neurostimulating Peptide as a Possible Modulating Factor against Glutamatergic Neuronal Disability by Amyloid Oligomers.Cell Transplant. 2017 Sep;26(9):1542-1550. doi: 10.1177/0963689717721232. Cell Transplant. 2017. PMID: 29113468 Free PMC article.
References
-
- Albensi B.C., Oliver D.R., Toupin J., Odero G. Electrical stimulation protocols for hippocampal synaptic plasticity and neuronal hyper-excitability: are they effective or relevant? Exp Neurol. 2007;204:1–13. - PubMed
-
- Bliss T.V.P., Collingridge G.L. A synaptic model of memory: long-term potentiation in the hippocampus. Nature. 1993;361:31–39. - PubMed
-
- Bliss T.V.P., Collingridge G.L., Morris R.G.M. Synaptic plasticity in the hippocampus. In: Andersen P., Morris R.G.M., Amaral D., Bliss T.V.P., O’Keefe J., editors. The hippocampus book. Oxford University Press; New York: 2007. pp. 343–474.
Publication types
MeSH terms
Grants and funding
LinkOut - more resources
Full Text Sources
Other Literature Sources
